Free Access
Fig. 5.
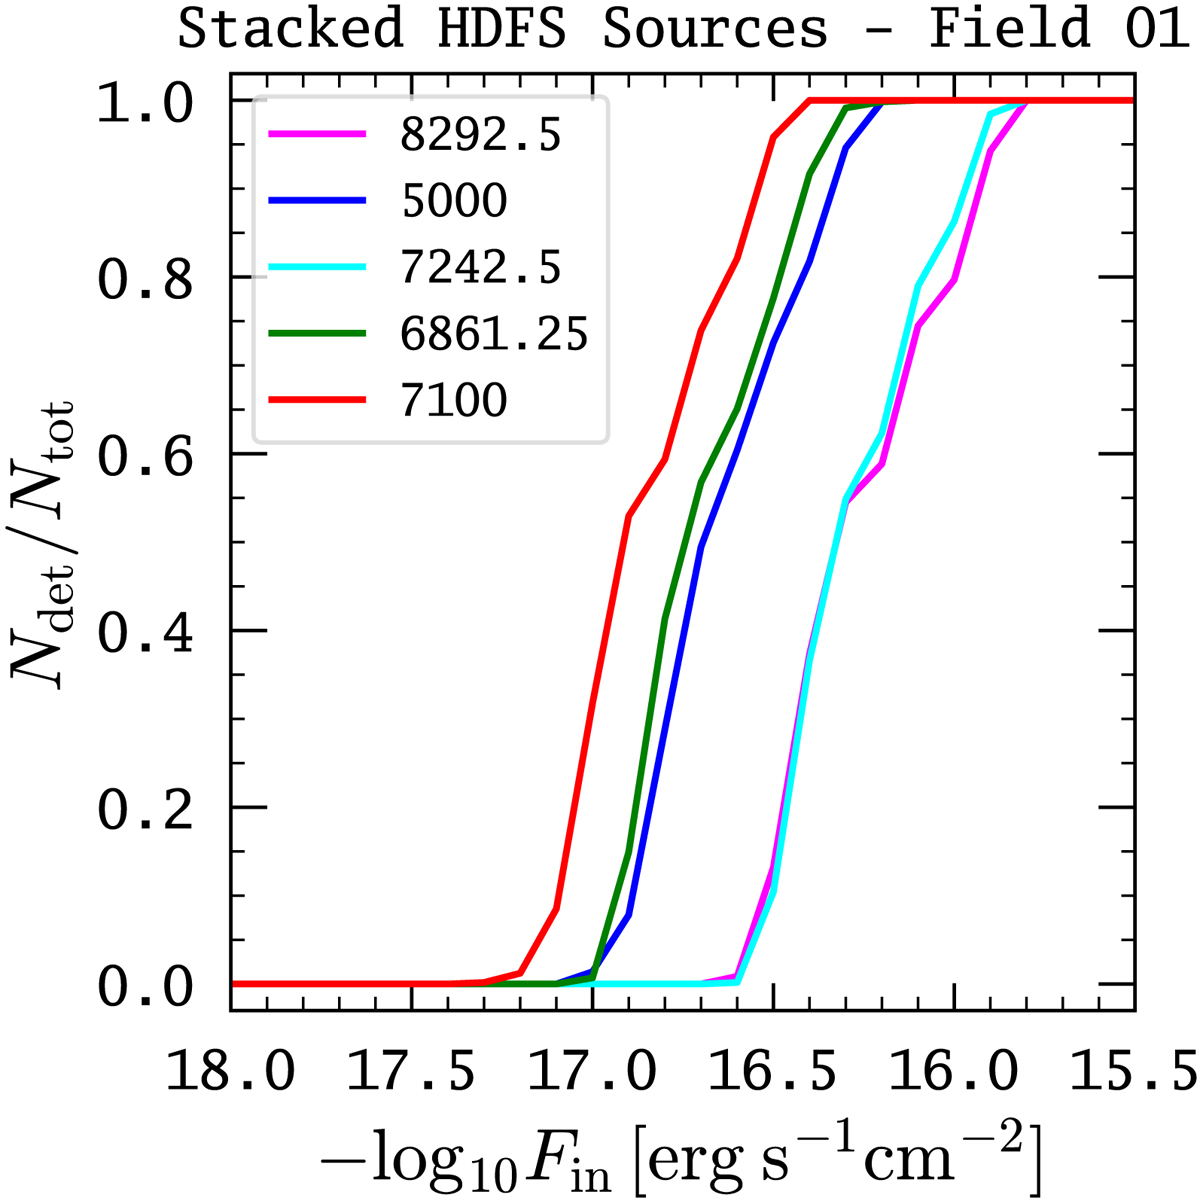
Stack over the recovery fractions Ndet./Ntotal of the ten different MUSE HDFS LAEs used in the source recovery experiment. These curves represent the selection function at five different wavelengths in a MW datacube. We only show the results for the MW datacubes 01; the shape of the curves are similar for all other fields.
Current usage metrics show cumulative count of Article Views (full-text article views including HTML views, PDF and ePub downloads, according to the available data) and Abstracts Views on Vision4Press platform.
Data correspond to usage on the plateform after 2015. The current usage metrics is available 48-96 hours after online publication and is updated daily on week days.
Initial download of the metrics may take a while.