Fig. 14.
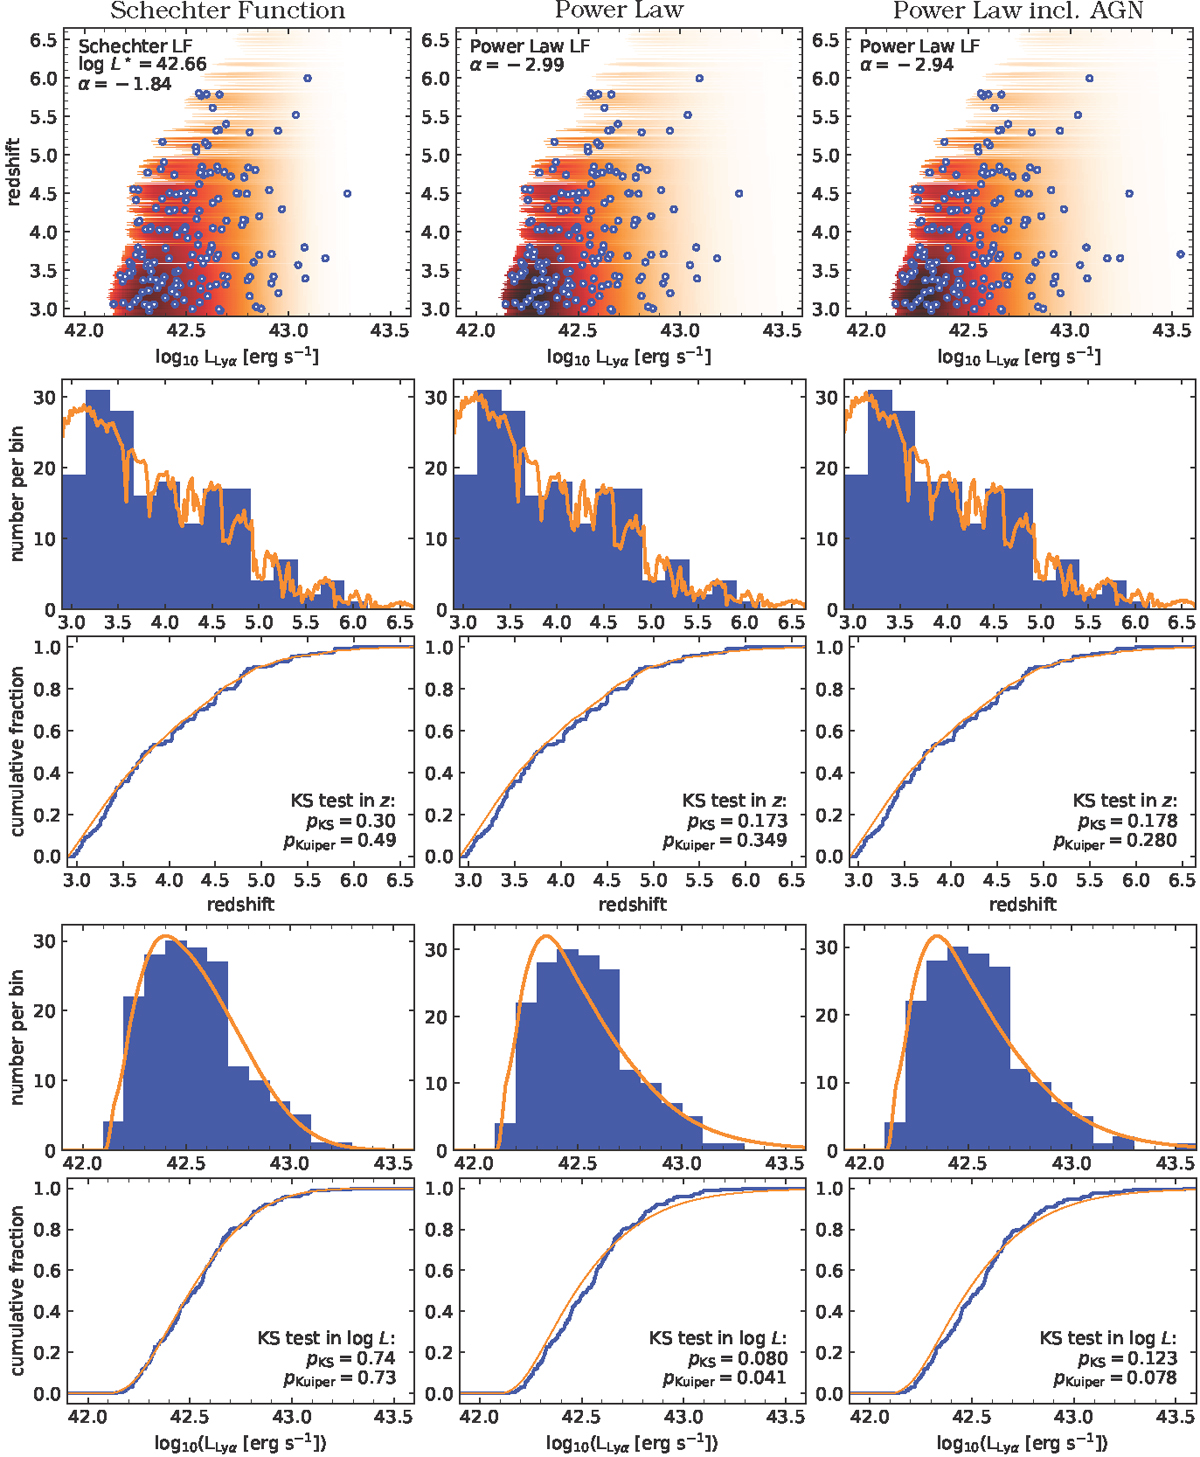
Visualisation of the procedure to calculate the Kuiper- and KS-test statistics for the Schechter model (left panels), power-law model (centre panels), and the power-law model fit to the LAE sample where the X-Ray identified AGN were not excluded (right panels). The panels in the first row show the expected LAE distribution in redshift-luminosity space from the best-fit parameterisations folded with the MW survey area, selection function, and fc = 0.15 truncation criterion in shaded orange, while blue circles show the actual LAE samples in redshift-luminosity space. The 2D KS-test statistic is computed by comparing the actual samples to the model distributions. The panels in the second row show predicted number counts computed from the distributions in the first row as a function of redshift in comparison to a histogram of the observed number counts (blue histogram). In the third row we show the comparison between the normalised cumulative distribution in redshift (blue line) and the cumulative distribution from the model (orange line). These curves are used to calculate the Kuiper and 1D KS-test in redshift. The panels in the fourth and fifth row are similar to those in the second and third row, respectively, but compare the differential and cumulative distribution in LLyα-space to the model distributions.
Current usage metrics show cumulative count of Article Views (full-text article views including HTML views, PDF and ePub downloads, according to the available data) and Abstracts Views on Vision4Press platform.
Data correspond to usage on the plateform after 2015. The current usage metrics is available 48-96 hours after online publication and is updated daily on week days.
Initial download of the metrics may take a while.