Fig. 12.
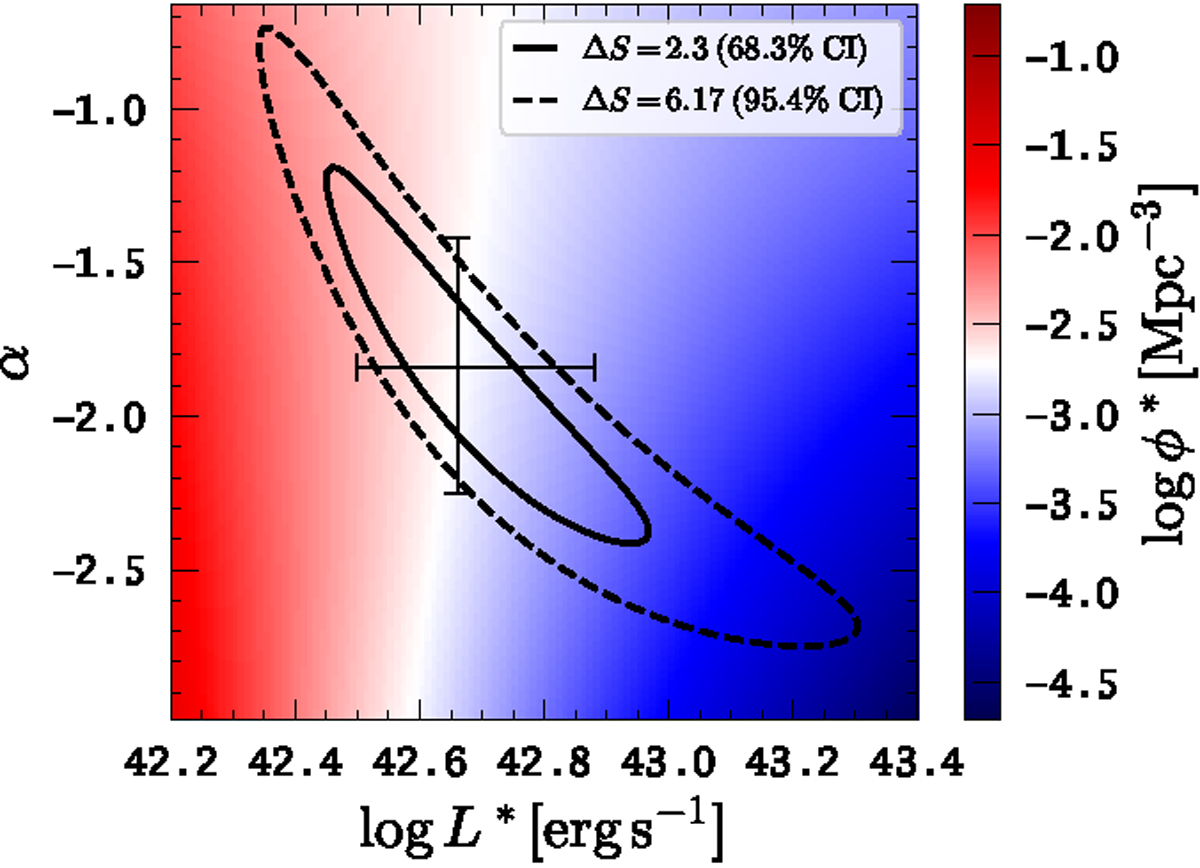
Results from the Schechter function ML fit for the global MW LAE LF. Contours are drawn at ΔS = {2.3, 6.17} thereby outlining the {68.3%,95.4%} confidence intervals for α and log L*. In colour we show the normalisation log ϕ*, which is a dependent quantity on α and L*, i.e. it is not a free parameter in the fitting procedure. The cross indicates the best-fitting (log L*[erg s−1],α)=(42.66, −1.84). At this point in log L* − α space the dependent normalisation is logϕ*(log L*, α)[Mpc−3]= − 2.71. The 1D error bars show the 68.3% confidence interval from the marginalised distribution in α and log L* (see text).
Current usage metrics show cumulative count of Article Views (full-text article views including HTML views, PDF and ePub downloads, according to the available data) and Abstracts Views on Vision4Press platform.
Data correspond to usage on the plateform after 2015. The current usage metrics is available 48-96 hours after online publication and is updated daily on week days.
Initial download of the metrics may take a while.