Free Access
Fig. 1.
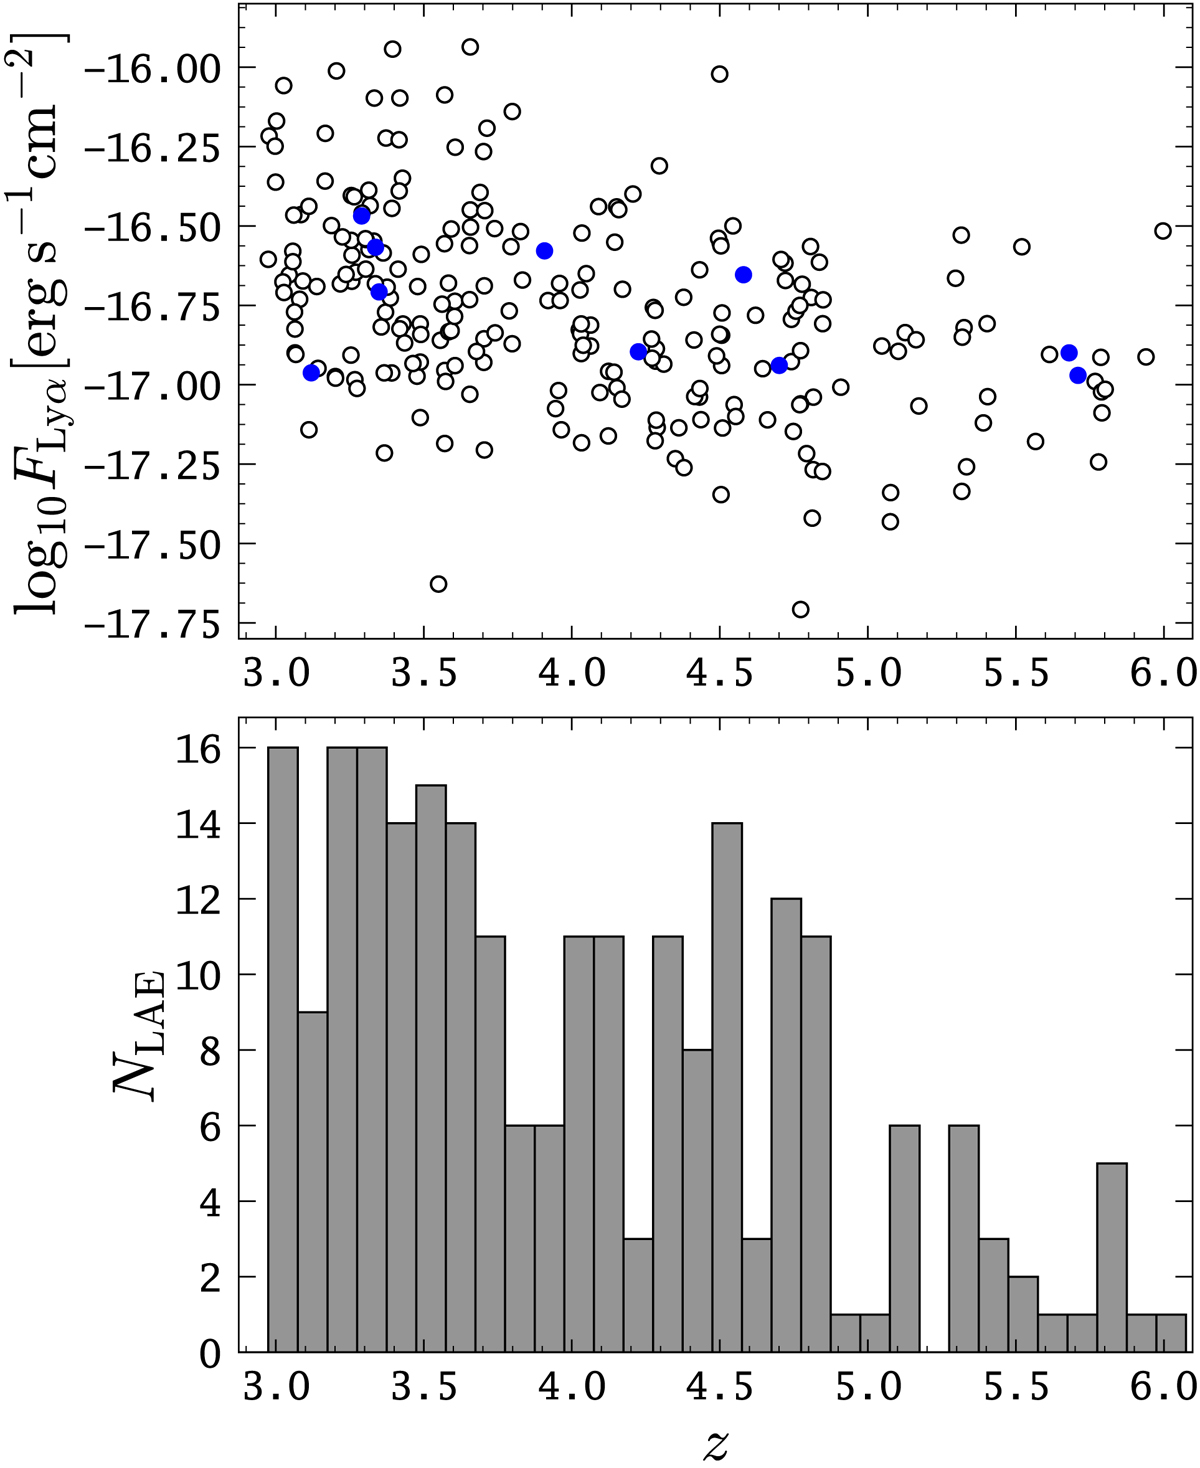
Top panel: fluxes and redshifts of the MW LAE sample used in this study (open circles) in comparison to the fluxes and redshifts of the MUSE HDFS LAEs used to determine a realistic selection function as described in Sect. 3.2 (filled circles). Bottom panel: redshift histogram of the MW LAE sample (binning: Δz = 0.1).
Current usage metrics show cumulative count of Article Views (full-text article views including HTML views, PDF and ePub downloads, according to the available data) and Abstracts Views on Vision4Press platform.
Data correspond to usage on the plateform after 2015. The current usage metrics is available 48-96 hours after online publication and is updated daily on week days.
Initial download of the metrics may take a while.