Fig. 8.
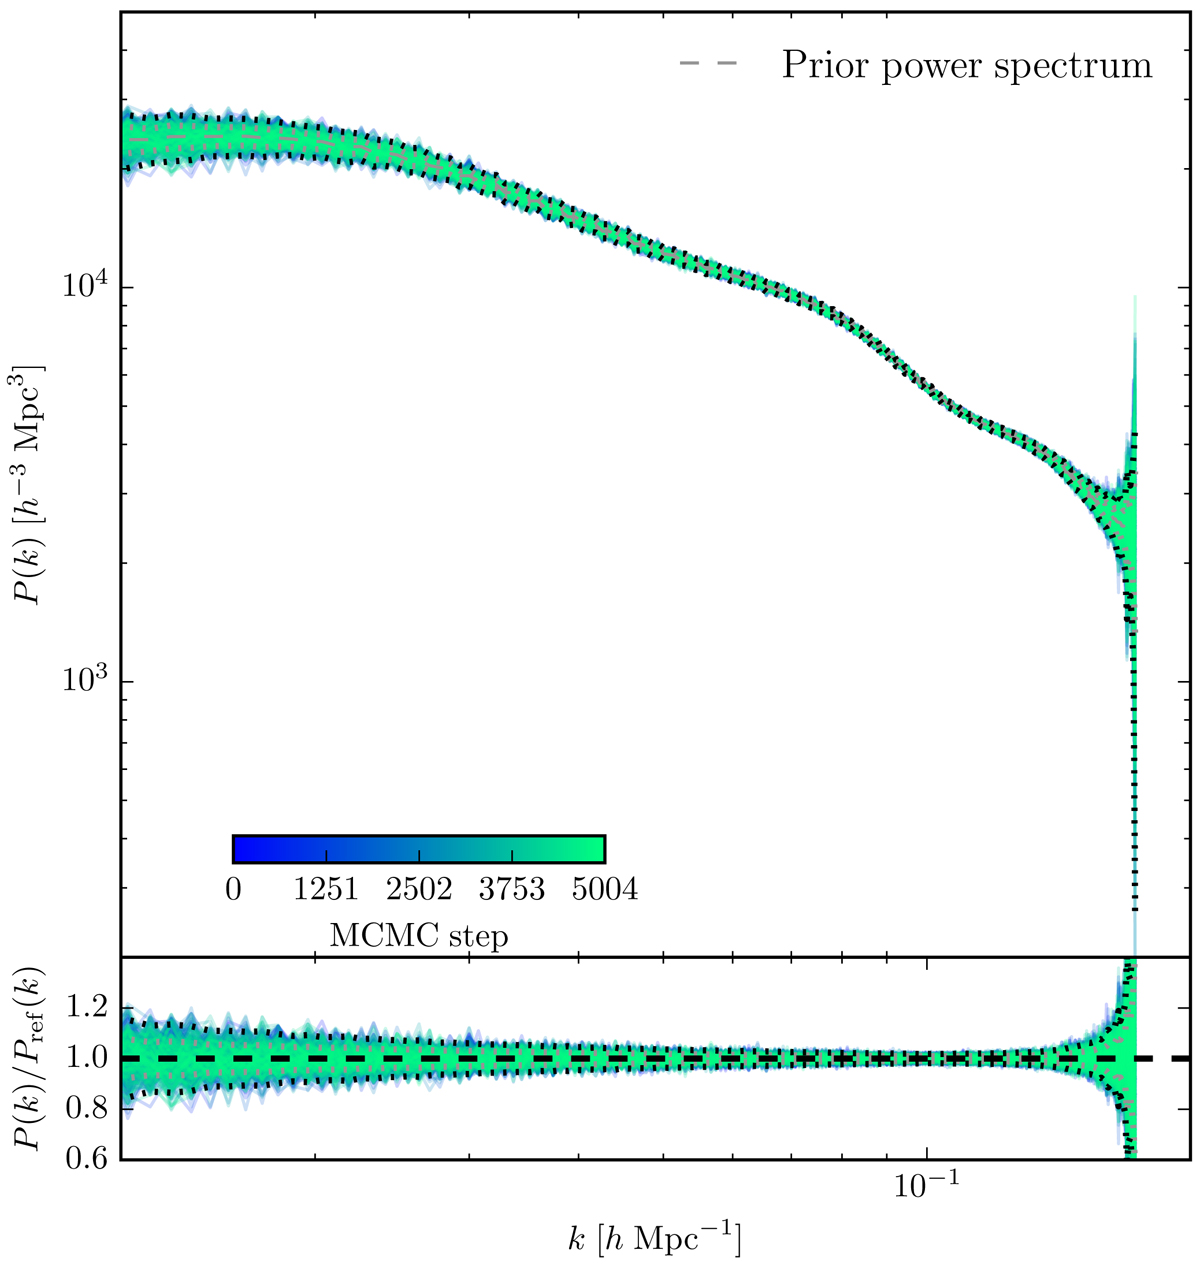
Top panel: reconstructed power spectra from the inferred posterior initial density field realisations for all sampling steps of the Markov chain. The MCMC samples are colour-coded according to their sample number, as indicated by the colour bar. This is a self-consistency test to verify whether the sampled density fields are in accordance with the reference power spectrum, depicted in dashed lines, employed in the mock generation. Bottom panel: deviation from the true underlying solution, with the thick dashed lines representing the prior power spectrum. The thin grey and black dotted lines correspond to the Gaussian 1σ and 2σ limits, respectively.
Current usage metrics show cumulative count of Article Views (full-text article views including HTML views, PDF and ePub downloads, according to the available data) and Abstracts Views on Vision4Press platform.
Data correspond to usage on the plateform after 2015. The current usage metrics is available 48-96 hours after online publication and is updated daily on week days.
Initial download of the metrics may take a while.