| Issue |
A&A
Volume 621, January 2019
|
|
|---|---|---|
| Article Number | A45 | |
| Number of page(s) | 6 | |
| Section | Galactic structure, stellar clusters and populations | |
| DOI | https://doi.org/10.1051/0004-6361/201834011 | |
| Published online | 04 January 2019 | |
The double blue-straggler sequence in NGC 2173: an artifact of field contamination
1
INAF - Astrophysics and Space Science Observatory Bologna, Via Gobetti 93/3, 40129, Bologna, Italy
e-mail: This email address is being protected from spambots. You need JavaScript enabled to view it.
2
Dipartimento di Fisica e Astronomia, Via Gobetti 93/2, 40129, Bologna, Italy
3
Astrophysics Research Institute, Liverpool John Moores University, 146 Brownlow Hill, Liverpool L3 5RF, UK
Received:
3
August
2018
Accepted:
29
October
2018
Abstract
Here we discuss the case of the double blue straggler star (BSS) sequence recently detected in the young stellar cluster NGC 2173 in the Large Magellanic Cloud (LMC) by Li et al. (2018, ApJ, 856, 25). In order to investigate this feature we made use of two Hubble Space Telescope (HST) sets of observations, one (the same one used by Li et al.) probing the cluster central regions, and the other sampling the surrounding field. We demonstrate that when field star decontamination is applied, ∼40% of the BSS population selected by Li et al. turns out to be composed of field stars interlopers. This contamination mainly affects one of the two sequences, which therefore disappears in the decontaminated color-magnitude diagram. We analyze the result of tens different decontamination realizations: we find no evidence of a double BSS sequence in any of them. We therefore conclude that NGC 2173 harbors a normal single (poorly populated) BSS sequence and that particular care needs to be devoted to the field decontamination process in any study aimed at probing stellar population features or star counts in the LMC clusters.
Key words: galaxies: star clusters: individual: NGC2173 / Hertzsprung-Russell and C-M diagrams / blue stragglers / techniques: photometric / methods: observational
© ESO 2019
1. Introduction
Blue straggler stars (BSSs) represent the most numerous exotic population (i.e., not explainable in terms of passive evolution of single stars) in stellar systems. They are observed in globular (GCs; see e.g.,Ferraro et al. 2003, 2012, 2018; Dalessandro et al. 2008a) and open clusters (Mathieu & Geller 2009) as well as in dwarf galaxies (Monelli et al. 2012). Blue straggler stars appear hotter and brighter than turn-off (TO) stars in optical color-magnitude diagrams (CMDs) of stellar systems (Ferraro et al. 1992, 1993, 1997), thus mimicking a sparse sequence of younger and more massive objects. Observational evidence (see e.g.,Shara et al. 1997; Ferraro et al. 2006a; Fiorentino et al. 2014; Brogaard et al. 2018) showed that indeed BSSs are up to twice more massive than TO stars in their host clusters.
Blue straggler stars can either be the result of mass accretion between two stars in a binary system (McCrea 1964; Zinn & Searle 1976) or the end products of stellar mergers induced by collisions between single stars or binary systems (Hills & Day 1976). While the first process is common to any stellar environment, being the result of the long-term evolution of binary systems, the second requires high-density environments. As a consequence, in GCs, where the stellar density varies significantly from the center to the external regions, BSSs can be generated by both processes with relative efficiencies depending on the local density (Fusi Pecci et al. 1992; Ferraro et al. 1999). In the high crowded cores of stellar clusters, both formation channels are expected to be active, although the mass-transfer process seems to be the most efficient one (see e.g., Knigge et al. 2009).
Interestingly, significant support to the co-existence of both collisional and mass-transfer BSSs in the same system, comes also from the detection of a double BSS sequence separated in color and magnitude in four post-core collapse Galactic GCs, namely M30 (Ferraro et al. 2009), NGC362 (Dalessandro et al. 2013), M15 (Beccari et al., in prep.), and NGC1261, which has been suggested to be in a post-core collapse bounce state (Simunovic et al. 2014). The fact that the two sequences are well separated in the CMDs suggests that they were generated by a recent and short-lived event instead of a continuous formation process.
Ferraro et al. (2009) proposed that the origin of the double sequence could be related to the core-collapse (CC) process that is expected to largely enhance the probability of collisions over a relatively short period of time (of the order of a few tens of millions of years), thus promoting the formation of collisional BSSs. In fact, during CC the central density rapidly increases, thus producing an increase in gravitational interactions (Meylan & Heggie 1997) able to trigger the formation of new BSSs through both direct stellar collisions and mass transfer activity induced by dynamical encounters involving primordial binaries (e.g., Leonard 1989; Hurley et al. 2005; Banerjee 2016). Therefore, the CC process could in principle generate a nearly coeval population of BSSs with different masses that in the CMD appears as a well-defined, tight sequence in addition to the “normal” (spread) BSS population constantly generated by the mass transfer process in primordial binaries, which are present in any environment. Indeed, the location of the collisional sequences in the CMD can be well reproduced by collisional models (Sills et al. 2009). Analogously to what is commonly done in the main-sequence fitting dating method, this allows us to use the extension in luminosity of the collisional sequence to date the epoch of the formation of the collisional BSSs, thus providing a rough idea of the epoch of CC in the parent cluster (Ferraro et al. 2009). Following these arguments Ferraro et al. (2009) and Dalessandro et al. (2013) concluded that the CC event occurred recently (1–2 Gyr ago) in both M30 and NGC362. The red BSS sequence is instead compatible with models of binary systems undergoing mass-transfer (Tian et al. 2006; Xin et al. 2015, but see the discussion in Jiang et al. 2017).
Recently, Li et al. (2018) claimed that the young (t ∼ 2 Gyr) GC NGC2173 in the Large Magellanic Cloud (LMC) also shows a double sequence of BSSs. NGC2173 is the only non-post-core-collapse cluster suggested to show a double BSS sequence so far. This result could therefore have important implications on our understanding of BSS double sequence formation. In fact, because of the cluster’s low central density and age, the authors argued that collisions are not a viable scenario to explain the blue BSS sequence in this case. On the contrary, they suggest that most likely the two sequences are populated by binaries with different mass ratios. However, they admit that it is unclear how this scenario can reproduce the observed discrete color and magnitude distribution.
The significance of the observational results presented by Li et al. (2018) is strongly hampered by the fact that they do not take into account field-star contamination. In LMC clusters, field interlopers can potentially have a large impact on the BSS region in the CMD, because of the large young LMC stellar component. In this work we re-analyze the BSS population properties and distribution taking into account the effect of field star contamination. To this aim, we used two different Hubble Space Telescope (HST) data sets, sampling both the cluster central regions and the surrounding LMC field. We find that about half of the BSS total sample used by Li et al. (2018) is actually populated by likely nonmember stars. More interestingly, we show that the decontamination analysis essentially removes all the BSS along the red sequence, thus demonstrating that the double sequence claimed by Li et al. (2018) is essentially an artifact due to the contamination of the LMC field stars.
2. Observations and data analysis
We used a combination of HST Wide Field Camera 3 – UVIS channel (WFC3/UVIS) and Advanced Camera for Survey – WFC (ACS/WFC) images obtained through proposal GO12257 (PI: Girardi). WFC3/UVIS data represent the primary observations and sample the innermost regions of the cluster (Cluster Pointing), while ACS/WFC data have been obtained as parallel observations (Field Pointing) and sample a region located at ∼300″ southward from the cluster (see Fig. 1).
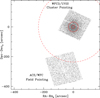 |
Fig. 1. Map of the WFC3/UVIS and ACS/WFC fields of view. The cluster core, half-light, and tidal radii (see Appendix) are shown in red. |
The most relevant details about the adopted sets of images are summarized in Table 1. For both data sets, an appropriate dither pattern of a few arcseconds has been adopted for each pointing in order to fill the inter-chip gaps and avoid spurious effects due to bad pixels.
Summary of the HST data set used in this work.
We used the FLC (which are corrected for charge transfer efficiency) pixel area map -corrected images. The photometric analysis was performed using DAOPHOT IV and relative routines, following the approach used in other works of our group (see Dalessandro et al. 2018a,b for a recent reference) Briefly, point spread function (PSF) models were derived for each image and chip by using some tens of stars and they were applied to stars whose flux peaks are above 3σ from the local background. A master list including stars detected in at least four images was then created. At the corresponding positions of stars in the master list, a fit was forced with DAOPHOT/ALLFRAME (Stetson 1994) in each frame of the two data sets. For each star thus recovered, multiple magnitude estimates obtained in each chip were homogenized using DAOMATCH and DAOMASTER, and their weighted mean and standard deviation were finally adopted as star magnitude and photometric error.
Instrumental magnitudes of both the WFC3 and ACS catalogs were calibrated onto the VEGAMAG photometric system using the recipes and zero points reported on the HST website. Instrumental coordinates were first corrected for geometric distortions by using equations by Bellini & Bedin (2009) for the WFC3/UVIS data and the most up-to-date Distortion Correction Tables (IDCTAB) provided on the dedicated website of the Space Telescope Science Institute for the ACS/WFC images. These coordinates were then reported to the absolute coordinate system (α, δ) as defined by the World Coordinate System of the HST images. The final CMDs for both data sets are shown in Fig. 2. We note that in agreement with Li et al. (2018), a double BSS sequence can be easily distinguished in the Cluster Pointing CMD.
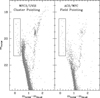 |
Fig. 2. m_F475W,mF475W − mF814W) CMDs of the Cluster Pointing and Field Pointing. The black boxes highlight the BSS region that has been used in the analysis (see Sect. 3). |
3. Density profile and structural parameters
In order to derive the structural parameters of the cluster we built the cluster number density profile by using both the Cluster and the Field HST data sets. This information, and the extension of the cluster in particular, are key for the decontamination procedure described in Sect. 4.
The analysis was performed following the procedure fully described in Miocchi et al. (2013; see also Lanzoni et al. 2010). We used the cluster’s center obtained by Li et al. (2018). We considered 11 concentric annuli centered on the cluster center, each one divided into two, three, or four sub-sectors. In each sub-sector, we counted the number of stars with mF606W < 21. The projected stellar density in each annulus is the mean of the values measured in each sub-sector and the uncertainty has been estimated from the variance among the sub-sectors. The observed density profile is shown in Fig. 3 (open circles). It smoothly declines as a function of distance and then it flattens at a distance of d > 200″ due to the contribution of the LMC field background. This has been estimated by averaging the two outermost values, and has been subtracted from the observed distribution to obtain the cluster (decontaminated) density profile (filled circles).
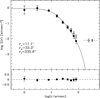 |
Fig. 3. Observed star count density profile of NGC2173 (open circles). The dashed line represents the density value of the background as derived by averaging the two outermost radial bins. The black filled dots are densities obtained after background subtraction. The best-fit single-mass King model is over-plotted (black solid line). Lower panel: residuals between the observations and the best-fit model. |
We then derived the cluster structural parameters by fitting the observed density profile with a spherical, isotropic, single-mass King (1966) model. The best-fit model results in a cluster with a King dimensionless potential W0 = 6.1, corresponding to a concentration parameter of c = 1.28, a core radius of rc = 11.1 ± 1.2)″, a half-mass radius rh = (33.2 ± 3.3)″, and a tidal radius rt = (235.6±23.5)″. Assuming a distance to the LMC of 50 kpc (Pietrzyński et al. 2013), these values correspond to 2.7, 8.1, and 57.1 pc, respectively. While the derived values of rc and rh are in relatively good agreement with literature estimates, rt is significantly smaller than that obtained by McLaughlin & van der Marel (2005) and Li et al. (2018), who quote 95.5 and 131.30 pc, respectively. Such a discrepancy is likely due to the lack of an appropriate control area allowing them to properly sample and subtract the LMC background.
4. Decontamination of color magnitude diagrams
The CMDs of the vast majority of stellar clusters in the Magellanic Clouds are strongly contaminated by field-star interlopers. In fact, as shown in Fig. 2 for the case of NGC2173, cluster evolutionary sequences are overlaid to similarly populated LMC star sequences. As a consequence, a proper decontamination is key when studies on specific portions and features in cluster CMDs are performed and/or when stellar population number counts are concerned.
Unfortunately, given the distance of the Magellanic Clouds, a detailed separation between field and cluster stars based on proper motion is only possible for a few cases. Moreover accurate Gaia DR2 proper-motion data are only available for the brightest stars. As a consequence, to assess the impact of field contamination on the CMD of NGC2173 we used a statistical approach based on the comparison between the distribution of stars in the cluster CMD, at different radial distances from the cluster center, and that of a region representative of the surrounding LMC field. As shown in Fig. 1, the available ACS/WFC Field Pointing is ideal to perform a suitable decontamination of the program cluster. In fact, the ACS/WFC field of view (FOV) provides a relatively large area (which is ∼50% larger than the WFC3/UVIS Cluster Pointing FOV) to sample the LMC star distribution. Moreover, it is located beyond the cluster tidal radius (see Sect. 3) thus ensuring that any contribution from cluster stars (if any) is negligible.
A first clue about the level of the LMC field contamination affecting the Cluster CMD can be obtained by applying the method described in Knoetig (2014, see also Cabrera-Ziri et al. 2016 for a similar application) which allows us to calculate the probability that a star in the Cluster Pointing CMD belongs to the field population. We divided both the Cluster and the Field CMDs in a regular grid of 0.3 × 0.25 mag2 and we counted the number of stars falling within each cell. The number counts of likely field stars were then corrected for the different area covered by the two data sets. We then used Eq. (23) in Knoetig (2014) to estimate the probability that stars observed in a given cell are cluster members. We refer the reader to that paper for all relevant details about the method.
This approach has the advantage of being applicable to cells with small and large numbers. The analysis shows that there are at least two regions in the Cluster CMD that are significantly contaminated by foreground LMC stars: the one including stars with (mF475W – mF814W) > 0.8 and mF475W > 21, where at least two LMC sub-populations older than NGC 2173 can be distinguished, and the BSS region, in which the member probability is below 20%.
In Fig. 2 we highlight with a rectangular box the BSS region in the (mF475W, mF475W − mF814W) CMDs of both the Cluster and the Field pointings. Even from a preliminary visual inspection it is evident that a significant contribution of the LMC field is expected in that region. In fact, we count 37 stars (± 6.2 as Poissonian error) in the WFC3 Cluster Pointing and 21 in the ACS/WFC Field Pointing. After rescaling this latter value to the WFC3/UVIS area, we obtain a total number of contaminants of 15 ± 3.9, which yields a possible number of likely BSS cluster members of 22 ± 7.2 in the Cluster Pointing (corresponding to roughly 60% of the observed sample).
In order to allow a direct comparison between the cluster and the field sequences, in Fig. 4 we co-added the two CMDs, highlighting in red the stars measured in the Field Pointing. The match of the sequences is impressive and clearly indicates the regions of the CMD that are mainly affected by the LMC field contamination, fully confirming the analysis discussed above. In fact, it is evident that the two SGB/RGB visible at (mF475W – mF814W) > 0.8 and mF475W > 21 are essentially due to the LMC field. Moreover, both the red giant branch and the helium red clump of the cluster are affected by field contamination, as well as the BSS region. In particular, from the comparison it also emerges that the distribution of the BSSs differs between the Field and the Cluster CMDs. In fact, field candidate BSSs (or young populations) tend to be preferentially distributed in the brightest and reddest portion of the box, thus suggesting that red BSSs in the Cluster CMD are less likely to be cluster members than the blue ones.
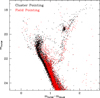 |
Fig. 4. (mF475W,mF475W − mF814W) CMD of the Field Pointing (in red) superimposed on the Cluster Pointing CMD (in black) for a direct comparison. Clearly, the SGB/RGB at mF475W − mF814W > 0.8 and mF475W > 21, as well as the BSS region are significantly contaminated by LMC stars. |
These simple arguments demonstrate that a very detailed analysis is needed to assess the possible presence of a double sequence such as the one claimed by Li et al. (2018).
To this aim we have statistically decontaminated the (mF475W, mF475W − mF814W) CMD using the following approach. We split the Cluster Pointing into five concentric annuli centered on the cluster center. We then partitioned the CMD corresponding to each annulus in the same grid of cells discussed above for the Field Pointing CMD. The same number of stars counted in the corresponding cell of the Field CMD were then randomly removed from the Cluster cell, accounting for the difference in the size of the areas covered by ACS and the WFC3 pointings. The stars surviving this analysis correspond to the likely cluster members and constitute the decontaminated CMD. The original CMD and the one resulting from the decontamination analysis are shown in Fig. 5 (to ease the comparison with Li et al. 2018 we show the results in the (mF336W, mF336W – mF814W) CMD). The analysis has efficiently removed highly probable LMC stars and thus the evolutionary sequences appear to be much better defined in the decontaminated CMD. As expected following the arguments discussed above, only about 25 BSSs survived the decontamination analysis. More importantly, the remaining BSS population is relatively scarce and shows no evidence of a double sequence.
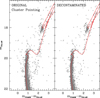 |
Fig. 5. Comparison between the observed Cluster Pointing CMD and one resulting from the statistical decontamination procedure described in Sect. 3. |
We performed the above analysis several tens of times by changing the cells’ dimensions and the grids’ limits. Some of the resulting decontaminated CMDs are shown in Fig. 6 as examples. As expected, while the exact number and position of the surviving BSSs may differ from one realization to another, the two main results remain: (i) the total fraction of BSS cluster members in the Cluster Field is only about 60% of the observed one; (ii) in none of the realizations do we find evidence of a double BSS sequence.
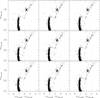 |
Fig. 6. Nine decontaminated CMDs obtained as described in Sect. 3, using different grid-cell widths and limits. In all cases there is no significant evidence of a double BSS sequence. |
5. Summary and conclusions
We used observations available in the HST archive to perform a detailed decontamination of the CMD of the young cluster NGC 2173 in the LMC, with the specific aim of assessing the existence of the double BSS sequence as recently claimed by Li et al. (2018). Our analysis demonstrates that the detected feature is an artifact due to the contamination by LMC field stars. NGC 2173 turns out to be a young cluster with a single and poorly populated BSS sequence, which is likely the result of binary evolution. As a consequence, the case of NGC 2173 is not relevant for the understanding and discussion of the origin of the double BSS sequences observed so far in a few old globular clusters (Ferraro et al. 2009; Dalessandro et al. 2013; Simunovic et al. 2014; Beccari et al., in prep.).
We used the decontaminated CMD shown in the right panel of Fig. 5 to select likely member BSSs and reference populations. We find that the BSS radial distribution in NGC 2173 is consistent (within the uncertainties related to the small number of stars and the decontamination process) with that of normal turn-off cluster stars. This is not surprising since the BSSs originating from the evolution of primordial binaries are expected to have, at their origin, a radial distribution indistinguishable from other lighter stars. Such a radial distribution can be maintained for a long time in dynamically unevolved clusters, where the timescale of the BSS sedimentation toward the cluster center due to dynamical friction is particularly long. This is indeed observed in many dynamically young Galactic clusters (see the cases of Omega Centauri Ferraro et al. 2006b, NGC 2419, and NGC 6101 Dalessandro et al. 2008b, 2015) even several gigayears after their formation (see the discussion in Ferraro et al. 2012, 2018; Lanzoni et al. 2016). Therefore, no peculiar phenomena need to be advocated to explain the BSS population of NGC 2173. Instead this case clearly points out the importance and the necessity of an appropriate field decontamination to properly assess any feature or star population counts in heavily contaminated stellar aggregates, such as the stellar clusters in the LMC.
Acknowledgments
ED acknowledges financial support from the Leverhulme Trust Visiting Professorship Programme VP2-2017-030. ED is also grateful for the warm hospitality of LJMU where part of this work was performed. NB gratefully acknowledges funding from the ERC under the European Union’s Horizon 2020 research and innovation programme via the ERC Consolidator Grant Multi-Pop (grant agreement number 646928, PI Bastian). NB is a Royal Society University Research Fellow. The authors thank the anonymous referee for his careful reading of the paper and useful comments.
References
- Bellini, A., & Bedin, L. R. 2009, PASP, 121, 1419 [NASA ADS] [CrossRef] [Google Scholar]
- Banerjee, S. 2016, Mem. Soc. Astron. It., 87, 497 [NASA ADS] [Google Scholar]
- Brogaard, K., Christiansen, S. M., Grundahl, F., et al. 2018, MNRAS, 481, 5062 [NASA ADS] [CrossRef] [Google Scholar]
- Cabrera-Ziri, I., Niederhofer, F., Bastian, N., et al. 2016, MNRAS, 459, 4218 [NASA ADS] [CrossRef] [Google Scholar]
- Dalessandro, E., Lanzoni, B., Ferraro, F. R., et al. 2008a, ApJ, 677, 1069 [NASA ADS] [CrossRef] [Google Scholar]
- Dalessandro, E., Lanzoni, B., Ferraro, F. R., et al. 2008b, ApJ, 681, 311 [NASA ADS] [CrossRef] [Google Scholar]
- Dalessandro, E., Ferraro, F. R., Massari, D., et al. 2013, ApJ, 778, 135 [NASA ADS] [CrossRef] [Google Scholar]
- Dalessandro, E., Ferraro, F. R., Massari, D., et al. 2015, ApJ, 810, 40 [NASA ADS] [CrossRef] [Google Scholar]
- Dalessandro, E., Cadelano, M., Vesperini, E., et al. 2018a, ApJ, 859, 15 [NASA ADS] [CrossRef] [Google Scholar]
- Dalessandro, E., Lardo, C., Cadelano, M., et al. 2018b, A&A, 618, A131 [NASA ADS] [CrossRef] [EDP Sciences] [Google Scholar]
- Ferraro, F. R., Fusi Pecci, F., & Buonanno, R. 1992, MNRAS, 256, 376 [NASA ADS] [CrossRef] [Google Scholar]
- Ferraro, F. R., Pecci, F. F., Cacciari, C., et al. 1993, AJ, 106, 2324 [NASA ADS] [CrossRef] [Google Scholar]
- Ferraro, F. R., Paltrinieri, B., Fusi Pecci, F., et al. 1997, A&A, 324, 915 [NASA ADS] [Google Scholar]
- Ferraro, F. R., Paltrinieri, B., Rood, R. T., & Dorman, B. 1999, ApJ, 522, 983 [NASA ADS] [CrossRef] [Google Scholar]
- Ferraro, F. R., Sills, A., Rood, R. T., Paltrinieri, B., & Buonanno, R. 2003, ApJ, 588, 464 [NASA ADS] [CrossRef] [Google Scholar]
- Ferraro, F. R., Sabbi, E., Gratton, R., et al. 2006a, ApJ, 647, L53 [NASA ADS] [CrossRef] [Google Scholar]
- Ferraro, F. R., Sollima, A., Rood, R. T., et al. 2006b, ApJ, 638, 433 [NASA ADS] [CrossRef] [Google Scholar]
- Ferraro, F. R., Beccari, G., Dalessandro, E., et al. 2009, Nature, 462, 1028 [NASA ADS] [CrossRef] [PubMed] [Google Scholar]
- Ferraro, F. R., Lanzoni, B., Dalessandro, E., et al. 2012, Nature, 492, 393 [NASA ADS] [CrossRef] [Google Scholar]
- Ferraro, F. R., Lanzoni, B., Raso, S., et al. 2018, ApJ, 860, 36 [NASA ADS] [CrossRef] [Google Scholar]
- Fiorentino, G., Lanzoni, B., Dalessandro, E., et al. 2014, ApJ, 783, 34 [NASA ADS] [CrossRef] [Google Scholar]
- Fusi Pecci, F., Ferraro, F. R., Corsi, C. E., Cacciari, C., & Buonanno, R. 1992, AJ, 104, 1831 [NASA ADS] [CrossRef] [Google Scholar]
- Hills, J. G., & Day, C. A. 1976, ApJ, 17, L87 [NASA ADS] [Google Scholar]
- Hurley, J. R., Pols, O. R., Aarseth, S. J., & Tout, C. A. 2005, MNRAS, 363, 293 [NASA ADS] [CrossRef] [Google Scholar]
- Jiang, D., Chen, X., Li, L., & Han, Z. 2017, ApJ, 849, 100 [NASA ADS] [CrossRef] [Google Scholar]
- King, I. R. 1966, AJ, 71, 64 [Google Scholar]
- Knigge, C., Leigh, N., & Sills, A. 2009, Nature, 457, 288 [NASA ADS] [CrossRef] [PubMed] [Google Scholar]
- Knoetig, M. L. 2014, ApJ, 790, 106 [NASA ADS] [CrossRef] [Google Scholar]
- Lanzoni, B., Ferraro, F. R., Dalessandro, E., et al. 2010, ApJ, 717, 653 [NASA ADS] [CrossRef] [Google Scholar]
- Lanzoni, B., Ferraro, F. R., Alessandrini, E., et al. 2016, ApJ, 833, L29 [NASA ADS] [CrossRef] [Google Scholar]
- Leonard, P. J. T. 1989, AJ, 98, 217 [NASA ADS] [CrossRef] [Google Scholar]
- Li, C., Deng, L., de Grijs, R., Jiang, D., & Xin, Y. 2018, ApJ, 856, 25 [NASA ADS] [CrossRef] [Google Scholar]
- Mathieu, R. D., & Geller, A. M. 2009, Nature, 462, 1032 [NASA ADS] [CrossRef] [PubMed] [Google Scholar]
- McCrea, W. H. 1964, MNRAS, 128, 147 [NASA ADS] [CrossRef] [Google Scholar]
- McLaughlin, D. E., & van der Marel, R. P. 2005, ApJS, 161, 304 [NASA ADS] [CrossRef] [Google Scholar]
- Meylan, G., & Heggie, D. C. 1997, A&ARv, 8, 1 [NASA ADS] [CrossRef] [Google Scholar]
- Miocchi, P., Lanzoni, B., Ferraro, F. R., et al. 2013, ApJ, 774, 151 [NASA ADS] [CrossRef] [Google Scholar]
- Monelli, M., Cassisi, S., Mapelli, M., et al. 2012, ApJ, 744, 157 [NASA ADS] [CrossRef] [Google Scholar]
- Pietrzyński, G., Graczyk, D., Gieren, W., et al. 2013, Nature, 495, 76 [NASA ADS] [CrossRef] [PubMed] [Google Scholar]
- Shara, M. M., Saffer, R. A., & Livio, M. 1997, ApJ, 489, L59 [NASA ADS] [CrossRef] [Google Scholar]
- Sills, A., Karakas, A., & Lattanzio, J. 2009, ApJ, 692, 1411 [NASA ADS] [CrossRef] [Google Scholar]
- Simunovic, M., Puzia, T. H., & Sills, A. 2014, ApJ, 795, L10 [NASA ADS] [CrossRef] [Google Scholar]
- Stetson, P. B. 1994, PASP, 106, 250 [NASA ADS] [CrossRef] [Google Scholar]
- Tian, B., Deng, L., Han, Z., & Zhang, X. B. 2006, A&A, 455, 247 [NASA ADS] [CrossRef] [EDP Sciences] [Google Scholar]
- Zinn, R., & Searle, L. 1976, ApJ, 209, 734 [NASA ADS] [CrossRef] [Google Scholar]
- Xin, Y., Ferraro, F. R., Lu, P., et al. 2015, ApJ, 801, 67 [NASA ADS] [CrossRef] [Google Scholar]
All Tables
All Figures
|
Fig. 1. Map of the WFC3/UVIS and ACS/WFC fields of view. The cluster core, half-light, and tidal radii (see Appendix) are shown in red. |
| In the text | |
|
Fig. 2. m_F475W,mF475W − mF814W) CMDs of the Cluster Pointing and Field Pointing. The black boxes highlight the BSS region that has been used in the analysis (see Sect. 3). |
| In the text | |
|
Fig. 3. Observed star count density profile of NGC2173 (open circles). The dashed line represents the density value of the background as derived by averaging the two outermost radial bins. The black filled dots are densities obtained after background subtraction. The best-fit single-mass King model is over-plotted (black solid line). Lower panel: residuals between the observations and the best-fit model. |
| In the text | |
|
Fig. 4. (mF475W,mF475W − mF814W) CMD of the Field Pointing (in red) superimposed on the Cluster Pointing CMD (in black) for a direct comparison. Clearly, the SGB/RGB at mF475W − mF814W > 0.8 and mF475W > 21, as well as the BSS region are significantly contaminated by LMC stars. |
| In the text | |
|
Fig. 5. Comparison between the observed Cluster Pointing CMD and one resulting from the statistical decontamination procedure described in Sect. 3. |
| In the text | |
|
Fig. 6. Nine decontaminated CMDs obtained as described in Sect. 3, using different grid-cell widths and limits. In all cases there is no significant evidence of a double BSS sequence. |
| In the text | |
Current usage metrics show cumulative count of Article Views (full-text article views including HTML views, PDF and ePub downloads, according to the available data) and Abstracts Views on Vision4Press platform.
Data correspond to usage on the plateform after 2015. The current usage metrics is available 48-96 hours after online publication and is updated daily on week days.
Initial download of the metrics may take a while.