Fig. 3.
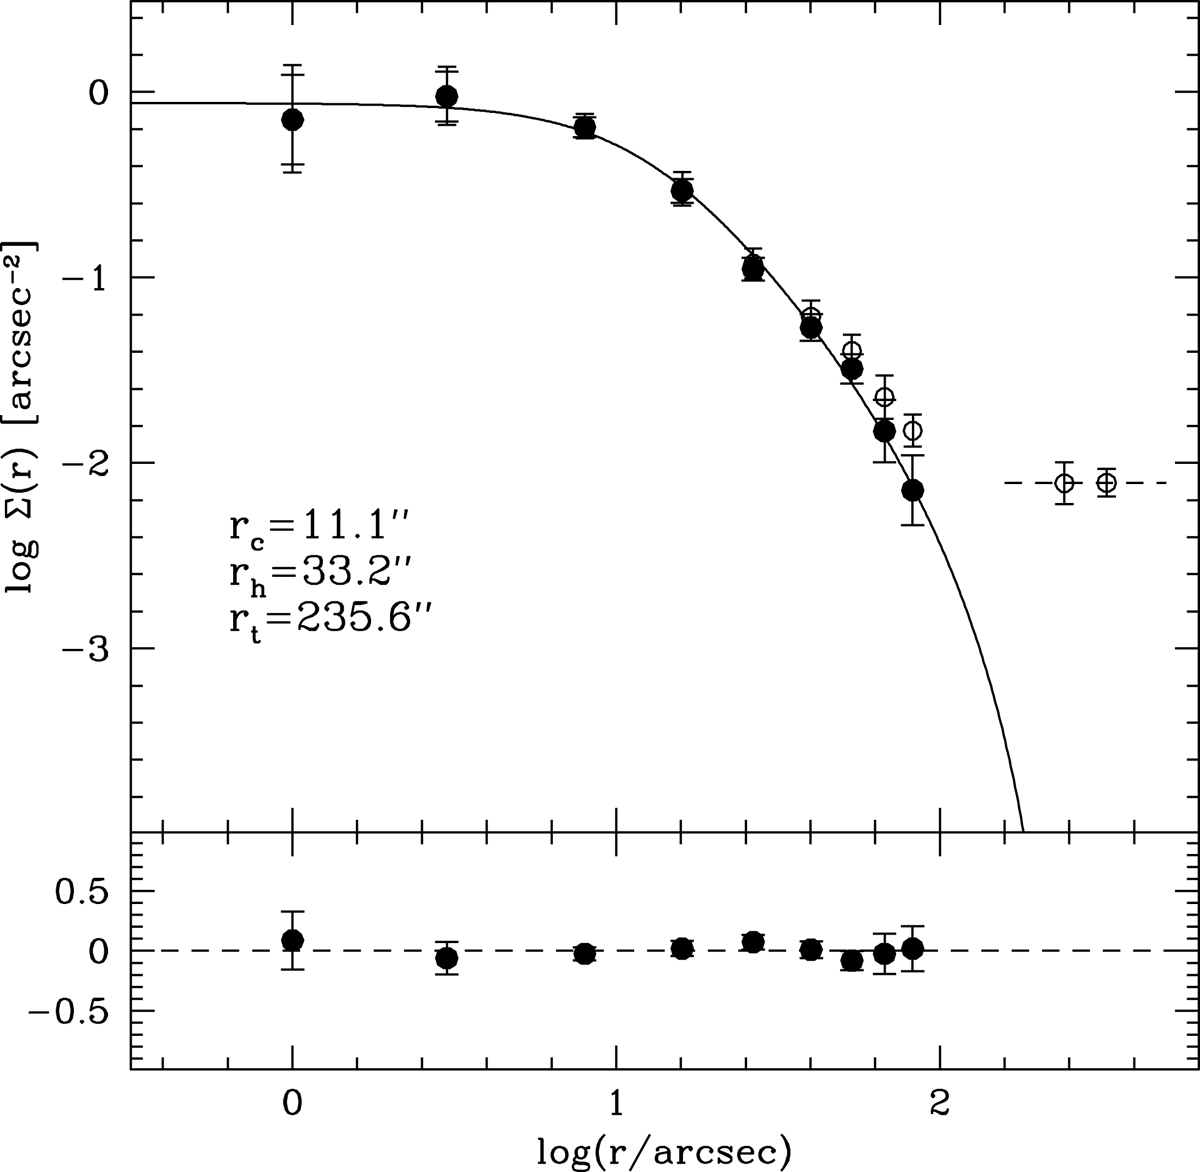
Observed star count density profile of NGC2173 (open circles). The dashed line represents the density value of the background as derived by averaging the two outermost radial bins. The black filled dots are densities obtained after background subtraction. The best-fit single-mass King model is over-plotted (black solid line). Lower panel: residuals between the observations and the best-fit model.
Current usage metrics show cumulative count of Article Views (full-text article views including HTML views, PDF and ePub downloads, according to the available data) and Abstracts Views on Vision4Press platform.
Data correspond to usage on the plateform after 2015. The current usage metrics is available 48-96 hours after online publication and is updated daily on week days.
Initial download of the metrics may take a while.