Fig. B.1.
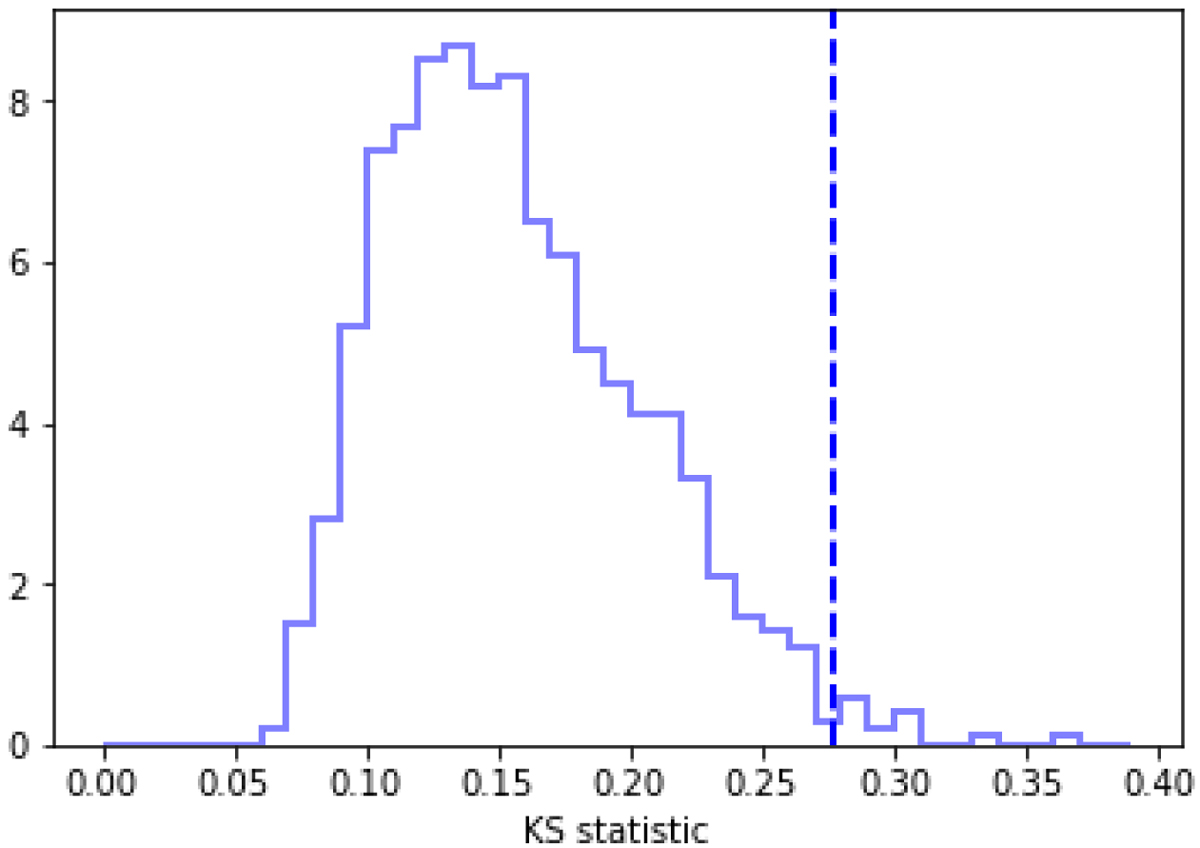
Distribution of the Kolmogorov–Smirnov statistic value when comparing the distribution of ηT in Fig. 4.2 and the 1000 realisations of the ![]() distribution for independent cluster sub-sets of the total 216 cluster set. The dashed line represents the value for which the similarity of the given sub-distribution of
distribution for independent cluster sub-sets of the total 216 cluster set. The dashed line represents the value for which the similarity of the given sub-distribution of ![]() and the entire distribution ηT can be rejected at 0.05 confidence. These cases constitute only 2% of all.
and the entire distribution ηT can be rejected at 0.05 confidence. These cases constitute only 2% of all.
Current usage metrics show cumulative count of Article Views (full-text article views including HTML views, PDF and ePub downloads, according to the available data) and Abstracts Views on Vision4Press platform.
Data correspond to usage on the plateform after 2015. The current usage metrics is available 48-96 hours after online publication and is updated daily on week days.
Initial download of the metrics may take a while.