Fig. 8.
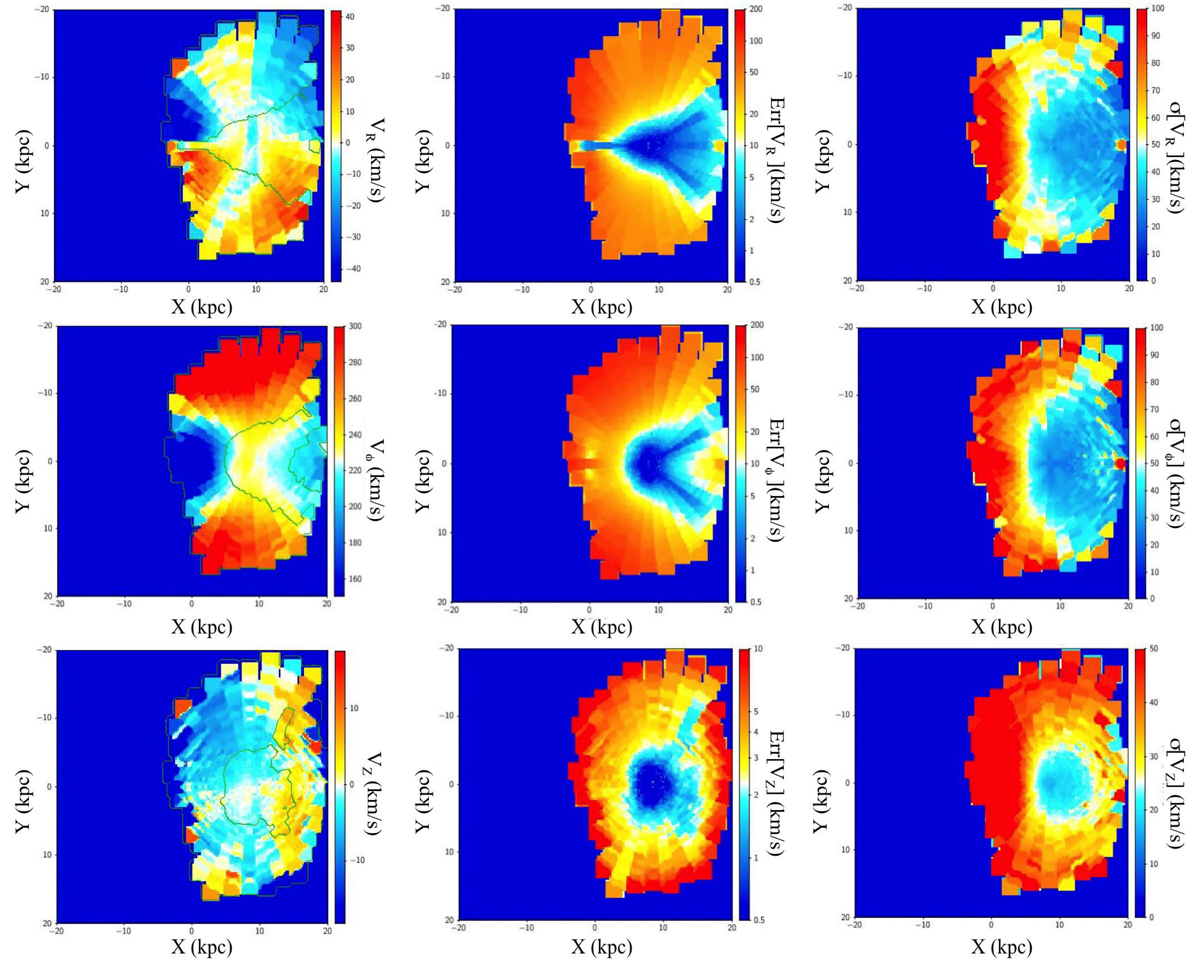
Left panels: three components (radial, azimuthal, and vertical, from top to bottom, respectively) of the Galactocentric velocity Median(V) as a function of ![]() and
and ![]() (X, Y with deconvolution correction according to Sect. 3.1). Application for Gaia-DR2 data including νr measurement with the constraints: |b|< 10°,
(X, Y with deconvolution correction according to Sect. 3.1). Application for Gaia-DR2 data including νr measurement with the constraints: |b|< 10°, ![]() . Inner green contour represents the region with error equal to 10, 10, and 2 km s−1 for VR, Vϕ, and VZ, respectively. Middle panels: error (in log scale) of V derived from the expansion in the formulae of
. Inner green contour represents the region with error equal to 10, 10, and 2 km s−1 for VR, Vϕ, and VZ, respectively. Middle panels: error (in log scale) of V derived from the expansion in the formulae of ![]() as systematic error and the dispersion of values of νr, μℓ, and μb divided by the root square of the number of points per bin as statistical errors. Right panels: rms value of V (corrected for measurement errors). Data of this figure are available at the CDS.
as systematic error and the dispersion of values of νr, μℓ, and μb divided by the root square of the number of points per bin as statistical errors. Right panels: rms value of V (corrected for measurement errors). Data of this figure are available at the CDS.
Current usage metrics show cumulative count of Article Views (full-text article views including HTML views, PDF and ePub downloads, according to the available data) and Abstracts Views on Vision4Press platform.
Data correspond to usage on the plateform after 2015. The current usage metrics is available 48-96 hours after online publication and is updated daily on week days.
Initial download of the metrics may take a while.