Fig. 2.
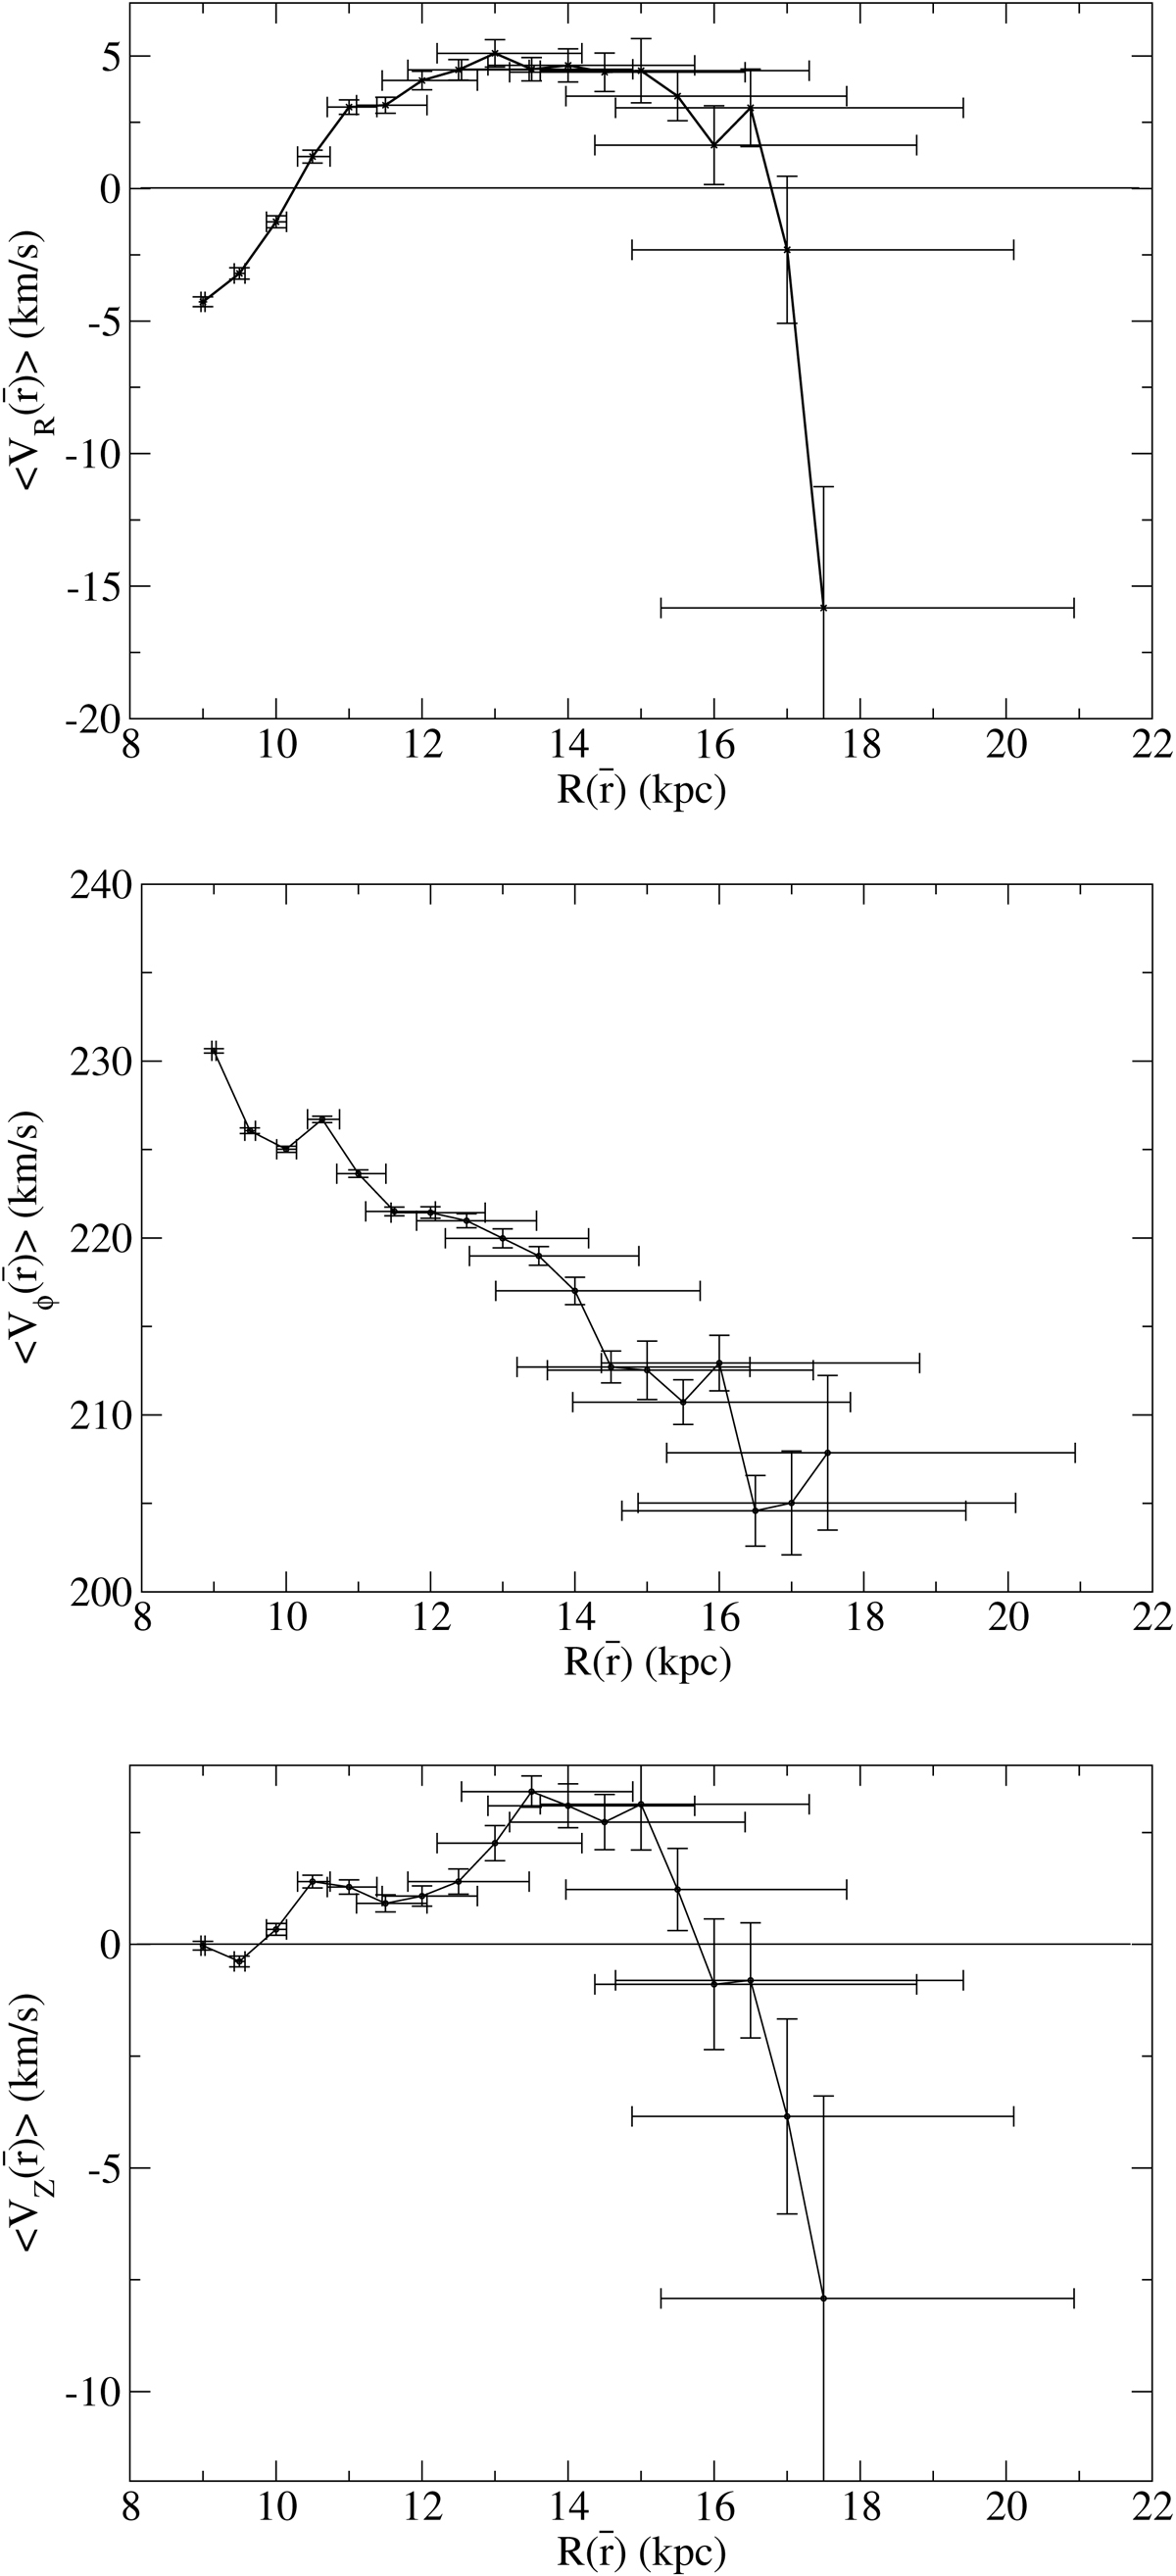
Median of Galactocentric radial (top panel) azimuthal (middle panel) and vertical (bottom panel) velocity as a function of ![]() (R with a deconvolution correction according to Sect. 3.1). This is the result for Gaia-DR2 data including νr measurements with the constraints: |ℓ−180 ° | < 20°, |b|< 10°,
(R with a deconvolution correction according to Sect. 3.1). This is the result for Gaia-DR2 data including νr measurements with the constraints: |ℓ−180 ° | < 20°, |b|< 10°, ![]() . Vertical bars indicate the errors on the median velocity (without including the uncertainty in distance). Horizontal bars indicate the rms value of the mean deconvolved R (thus the indicated value is an average over that range of dispersion).
. Vertical bars indicate the errors on the median velocity (without including the uncertainty in distance). Horizontal bars indicate the rms value of the mean deconvolved R (thus the indicated value is an average over that range of dispersion).
Current usage metrics show cumulative count of Article Views (full-text article views including HTML views, PDF and ePub downloads, according to the available data) and Abstracts Views on Vision4Press platform.
Data correspond to usage on the plateform after 2015. The current usage metrics is available 48-96 hours after online publication and is updated daily on week days.
Initial download of the metrics may take a while.