Fig. A.1.
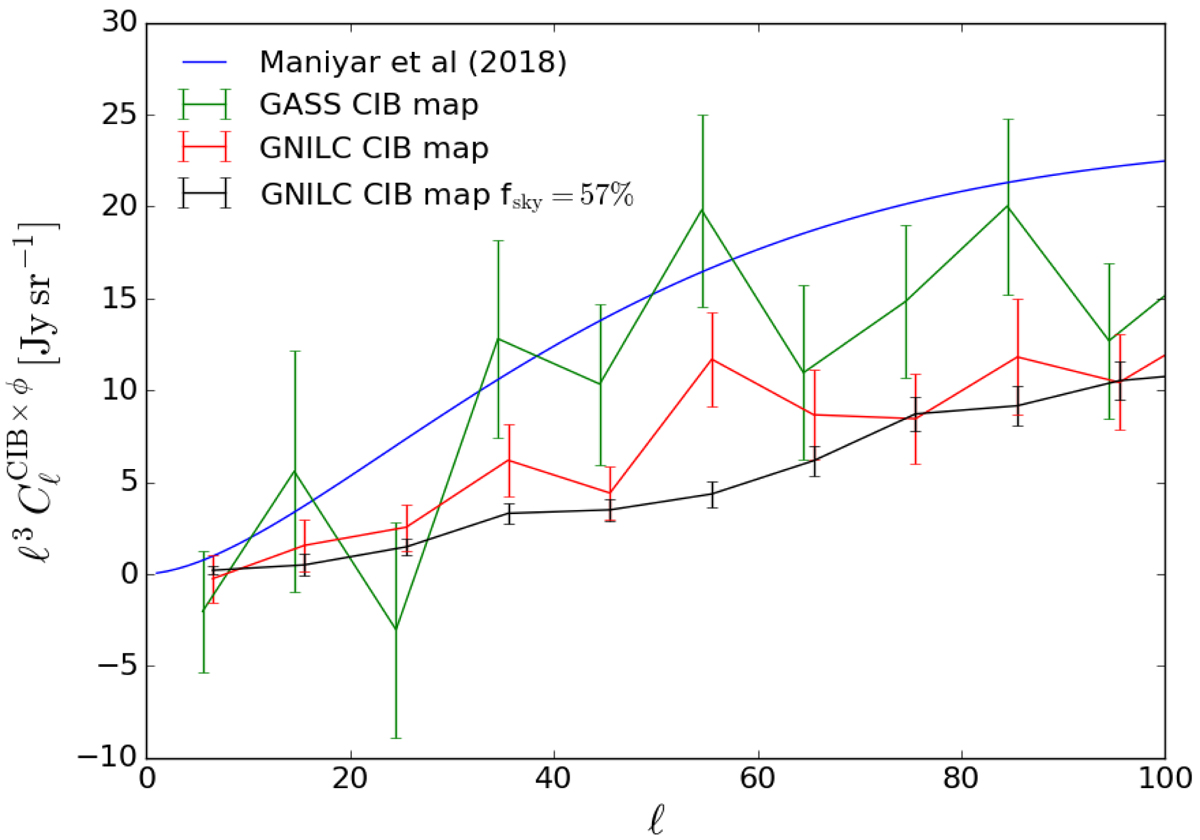
CIB×CMB lensing cross-power spectra for 2 ≤ ℓ ≤ 100 at 545 GHz. The blue curve shows the CIB×CMB lensing model from Maniyar et al. (2018). The green, red, and black curves show the measured cross-correlation for GASS CIB map, GASS GNILC map, and GNILC maps on 57% of the sky, respectively. The cross-correlation is consistently below the Maniyar et al. (2018) model for the GNILC CIB map. The cross-correlation obtained with the GASS CIB map agrees better with the Maniyar et al. (2018) model.
Current usage metrics show cumulative count of Article Views (full-text article views including HTML views, PDF and ePub downloads, according to the available data) and Abstracts Views on Vision4Press platform.
Data correspond to usage on the plateform after 2015. The current usage metrics is available 48-96 hours after online publication and is updated daily on week days.
Initial download of the metrics may take a while.