Fig. 7.
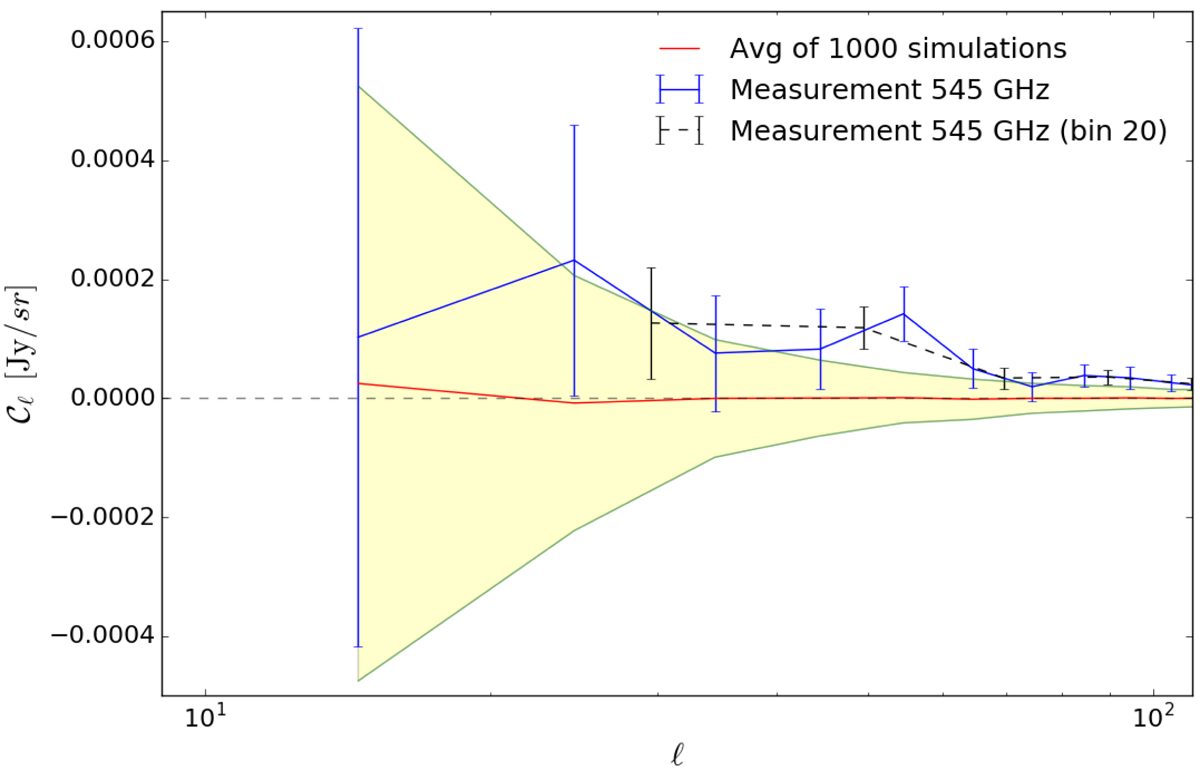
Average null signal calculated using the cross-correlation of the GASS CIB field with 1000 random CMB maps shown in red. The shaded area in yellow spans the 1σ region of the null signal, which is represented by the green lines. The measured CIB×CMB cross-correlation is shown in blue. We also show the CIB×CMB cross-correlation measured using a bin size Δℓ=20 instead of 10 (black points and dashed line).
Current usage metrics show cumulative count of Article Views (full-text article views including HTML views, PDF and ePub downloads, according to the available data) and Abstracts Views on Vision4Press platform.
Data correspond to usage on the plateform after 2015. The current usage metrics is available 48-96 hours after online publication and is updated daily on week days.
Initial download of the metrics may take a while.