Fig. 3.
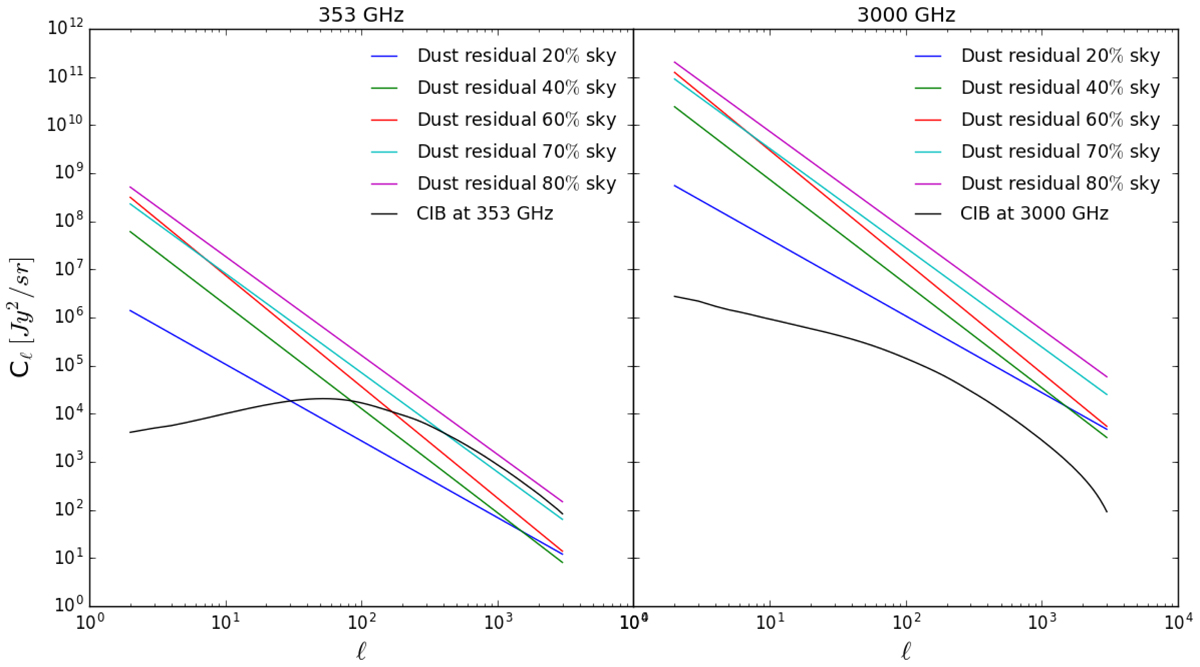
Power spectra of the CIB and 10% of the dust residual at 353 GHz (left panel) and 3000 GHz (right panel). The dust power spectra are computed over 20, 40, 60, 70, and 80% of the sky. The residual dust power spectra dominate the CIB at the low multipoles of interest for the ISW signal. As a consequence, the S/N decreases dramatically compared to the ideal dust-free case.
Current usage metrics show cumulative count of Article Views (full-text article views including HTML views, PDF and ePub downloads, according to the available data) and Abstracts Views on Vision4Press platform.
Data correspond to usage on the plateform after 2015. The current usage metrics is available 48-96 hours after online publication and is updated daily on week days.
Initial download of the metrics may take a while.