Fig. 8.
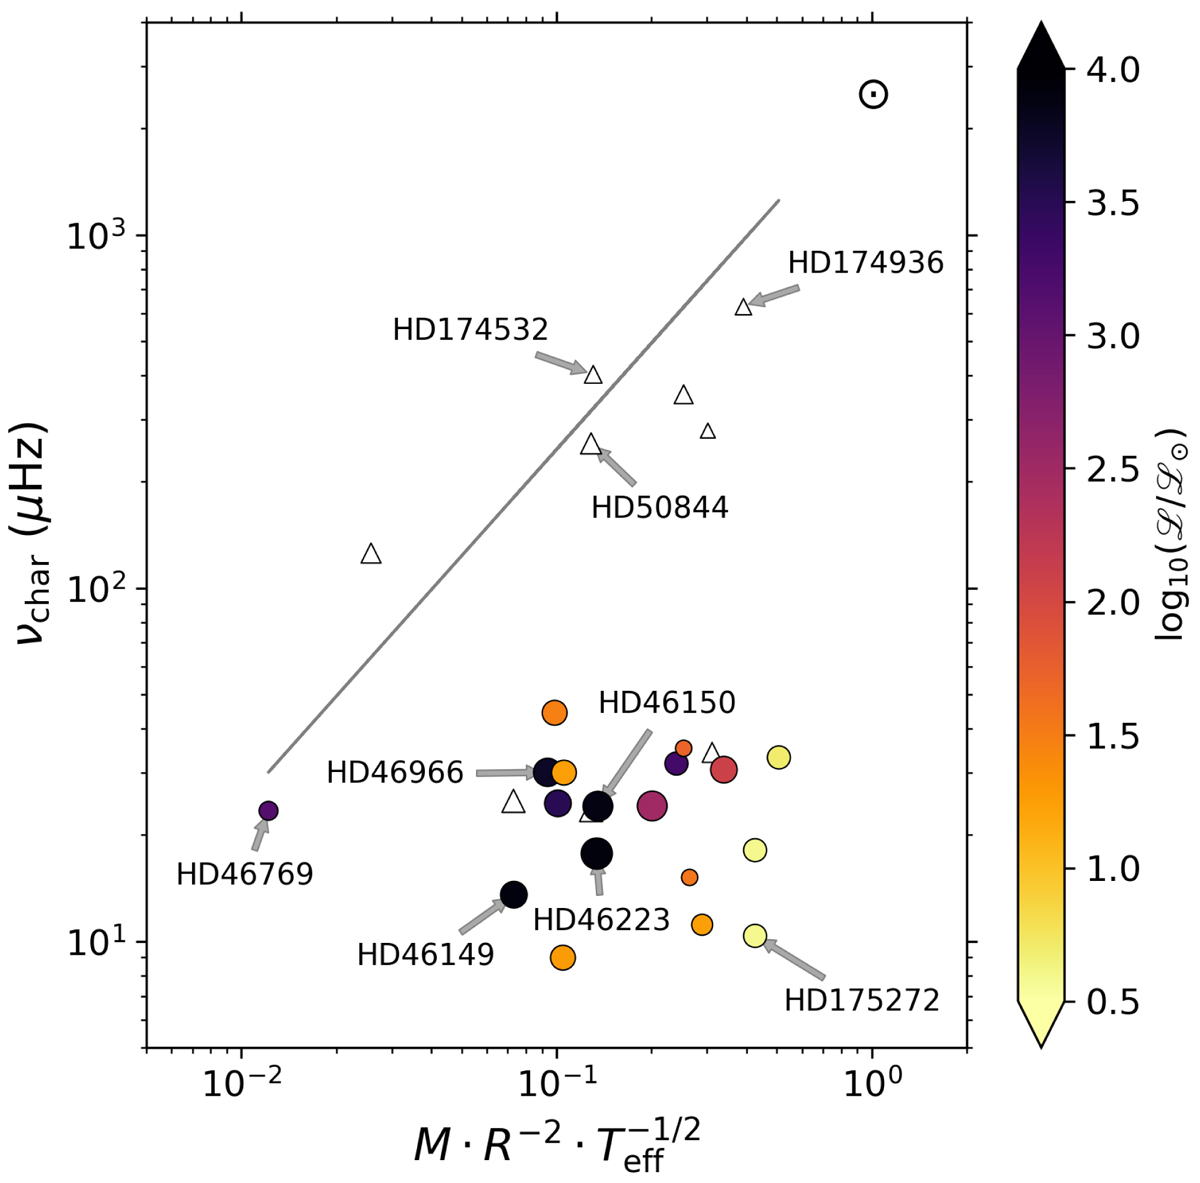
Distribution of measured characteristic frequencies, νchar, as a function of stellar parameters given in solar units. The grey line represents the granulation frequency scaled using Eq. (3) with the Sun’s location indicated by the ⊙ symbol. The circles have been colour-coded by a star’s spectroscopic luminosity and the size of the symbol is proportional to the fitting parameter, α0. White triangles represent stars which may have insufficient CoRoT data for an accurate determination for the fitting parameter γ (cf. Eq. (3)).
Current usage metrics show cumulative count of Article Views (full-text article views including HTML views, PDF and ePub downloads, according to the available data) and Abstracts Views on Vision4Press platform.
Data correspond to usage on the plateform after 2015. The current usage metrics is available 48-96 hours after online publication and is updated daily on week days.
Initial download of the metrics may take a while.