Fig. 3.
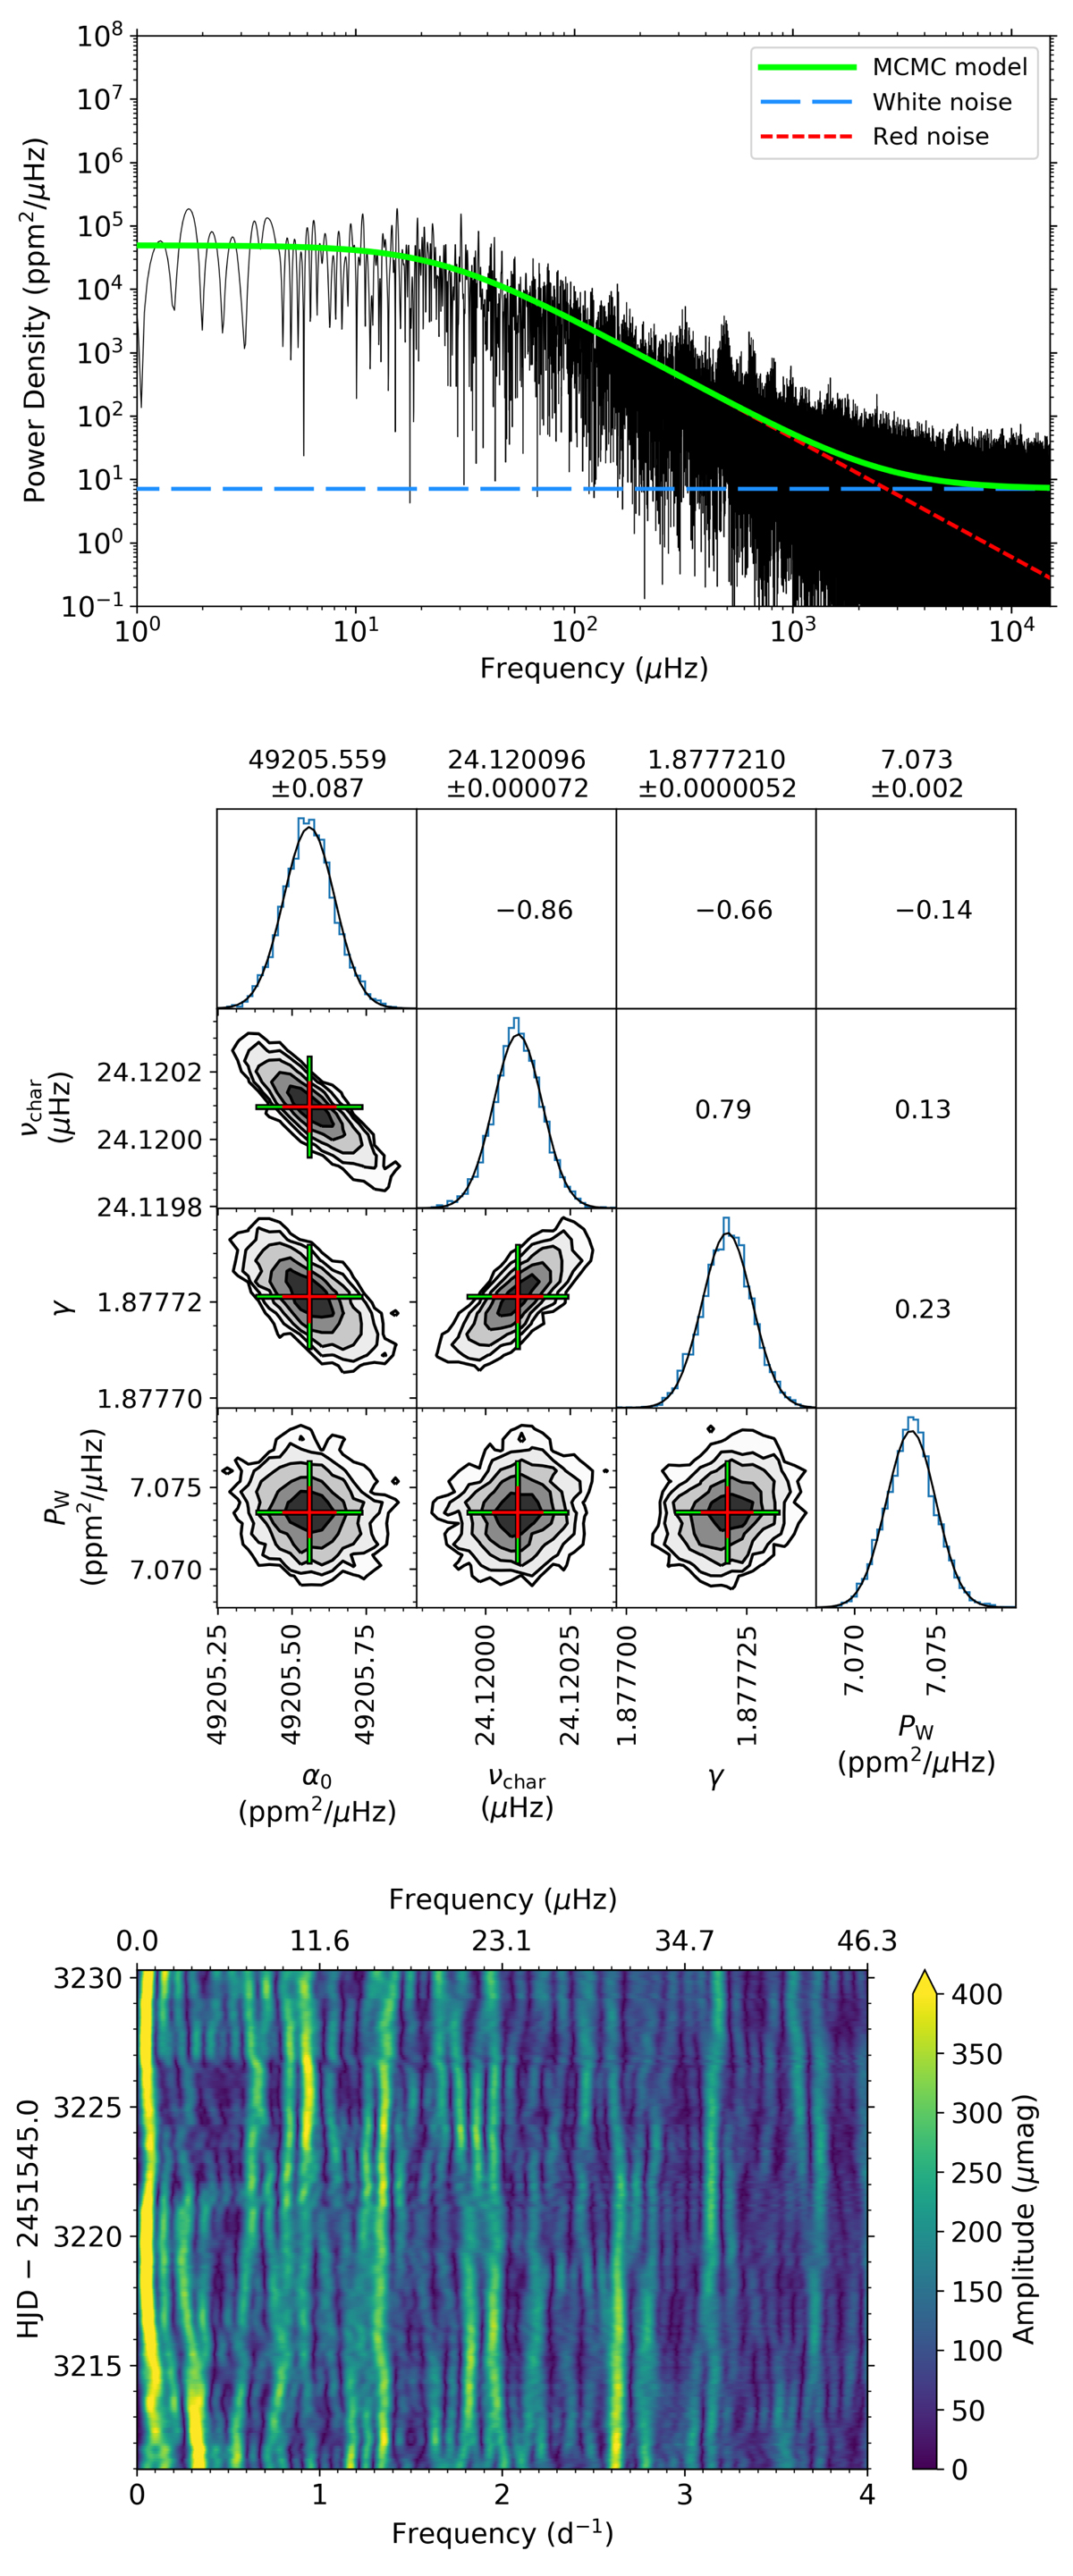
Top panel: logarithmic power density spectrum of the CoRoT photometry for the O star HD 46150 is shown in black, and the best-fit model obtained using Eq. (1) is shown as the solid green line, with its red and white components shown as red short-dashed and blue long-dashed lines, respectively. Middle panel: posterior distributions from the Bayesian MCMC, with best-fit parameters obtained from Gaussian fits (shown in black) to the 1D histograms (shown in blue). Bottom panel: a sliding Fourier transform in the (linear) frequency range of 0 ≤ ν ≤ 4 d−1 using a 15-d bin and a step of 0.1 d.
Current usage metrics show cumulative count of Article Views (full-text article views including HTML views, PDF and ePub downloads, according to the available data) and Abstracts Views on Vision4Press platform.
Data correspond to usage on the plateform after 2015. The current usage metrics is available 48-96 hours after online publication and is updated daily on week days.
Initial download of the metrics may take a while.