Free Access
Fig. 11.
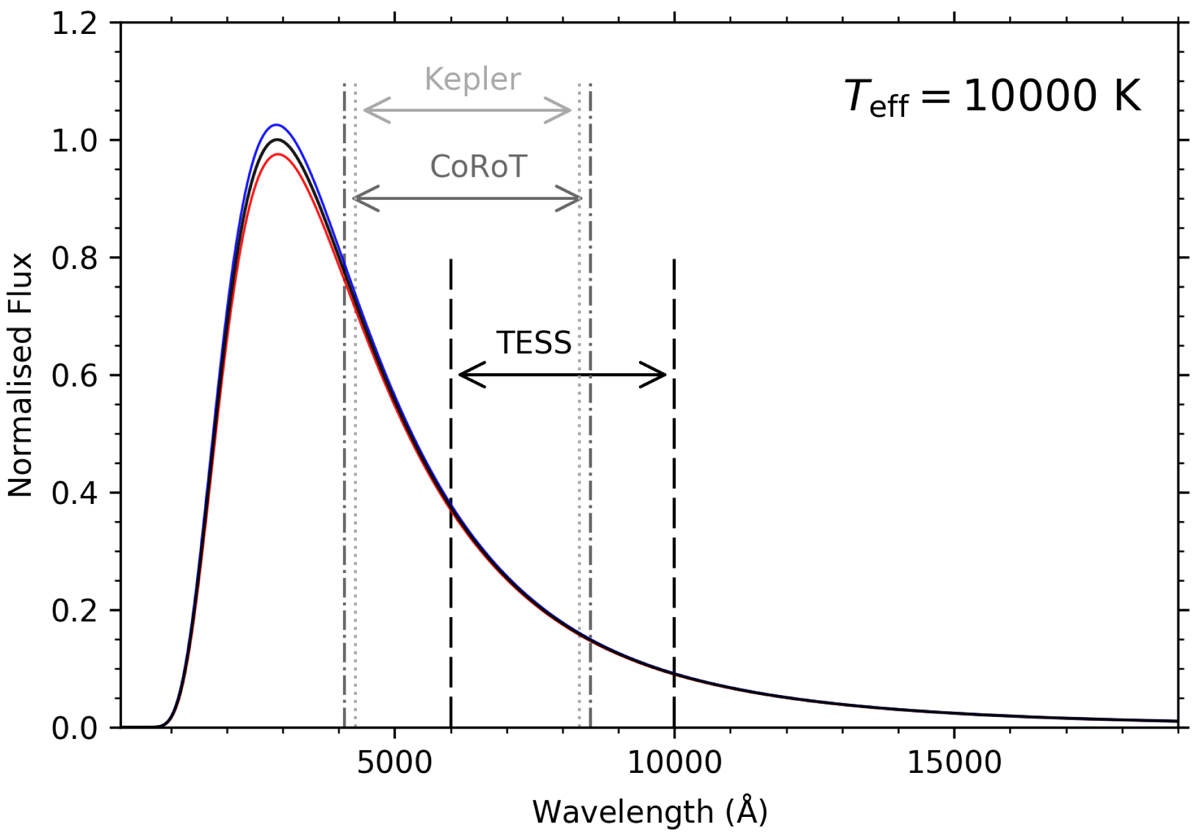
Normalised Planck blackbody function for a Teff = 10 000 K star, and hotter and cooler perturbations caused by pulsations are shown as black, blue and red solid lines, respectively. The approximate wavelength ranges for TESS, CoRoT and Kepler passbands are shown as dashed, dash-dot and dotted lines, respectively.
Current usage metrics show cumulative count of Article Views (full-text article views including HTML views, PDF and ePub downloads, according to the available data) and Abstracts Views on Vision4Press platform.
Data correspond to usage on the plateform after 2015. The current usage metrics is available 48-96 hours after online publication and is updated daily on week days.
Initial download of the metrics may take a while.