Fig. 3.
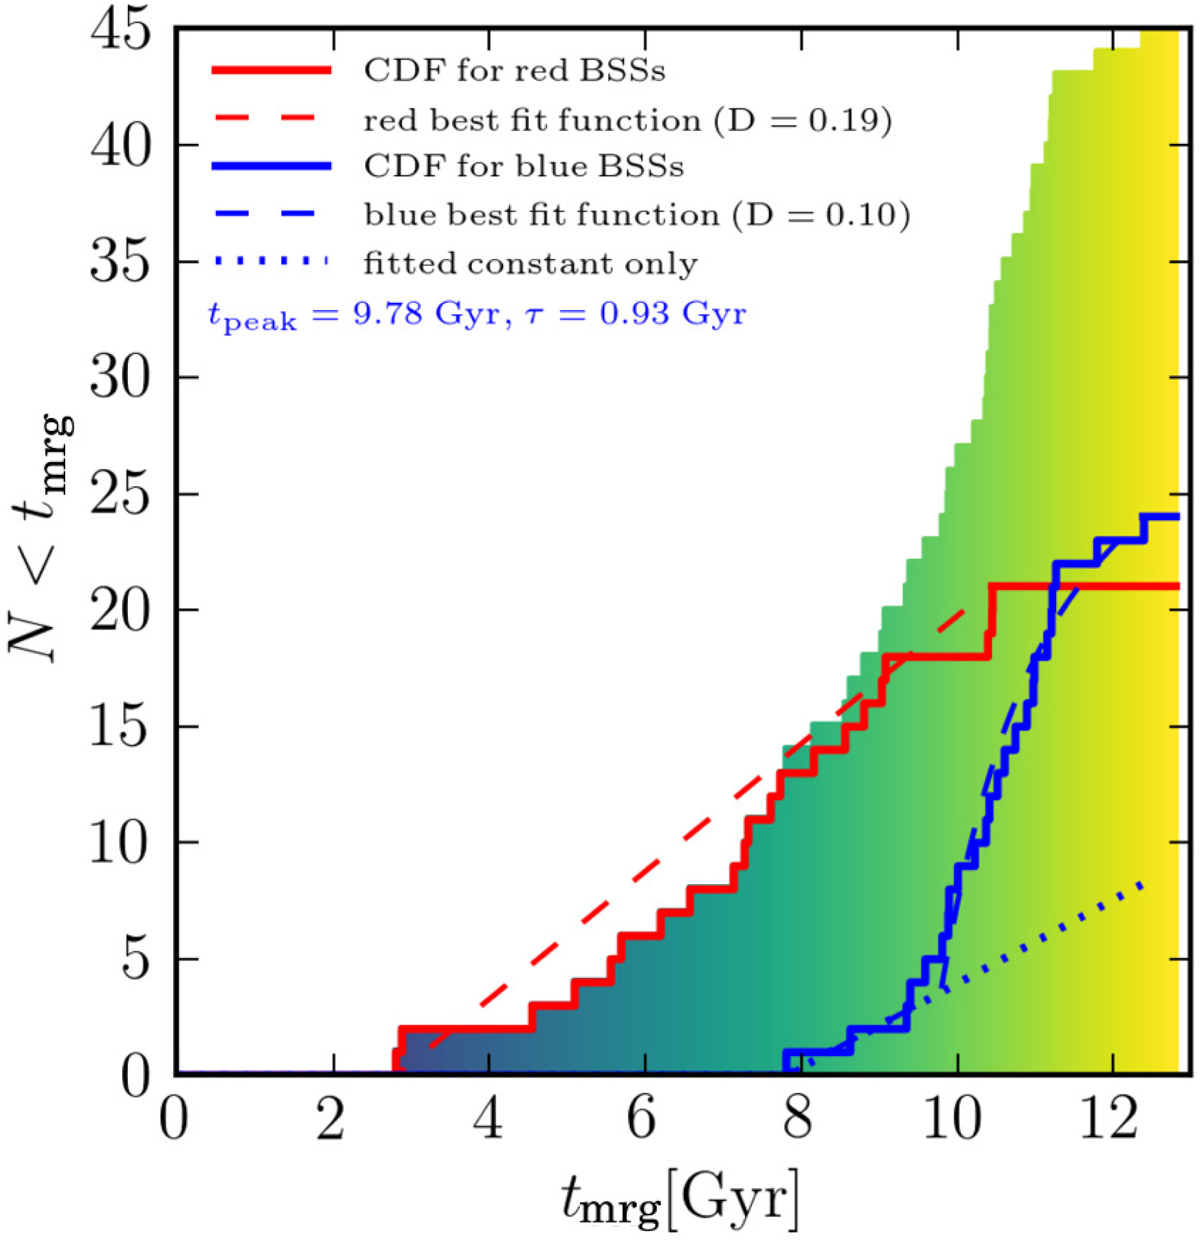
Cumulative distribution of merger times (tmrg) for all the blue stragglers (blue plus red as the color-shaded area where the color corresponds to that in Fig. 2). The solid blue and solid red curves give the cumulative distribution for the blue and red blue stragglers, respectively. The dashed and dotted blue curves give the fit to the blue blue stragglers (the dotted curve gives the linear component and dashes give the sum of the exponential and the linear fits). The red dashed curve gives the linear fit to the red blue stragglers. The color coding is identical to that used in Fig. 2, here indicating the time since the merger occurred.
Current usage metrics show cumulative count of Article Views (full-text article views including HTML views, PDF and ePub downloads, according to the available data) and Abstracts Views on Vision4Press platform.
Data correspond to usage on the plateform after 2015. The current usage metrics is available 48-96 hours after online publication and is updated daily on week days.
Initial download of the metrics may take a while.