Free Access
Fig. 1.
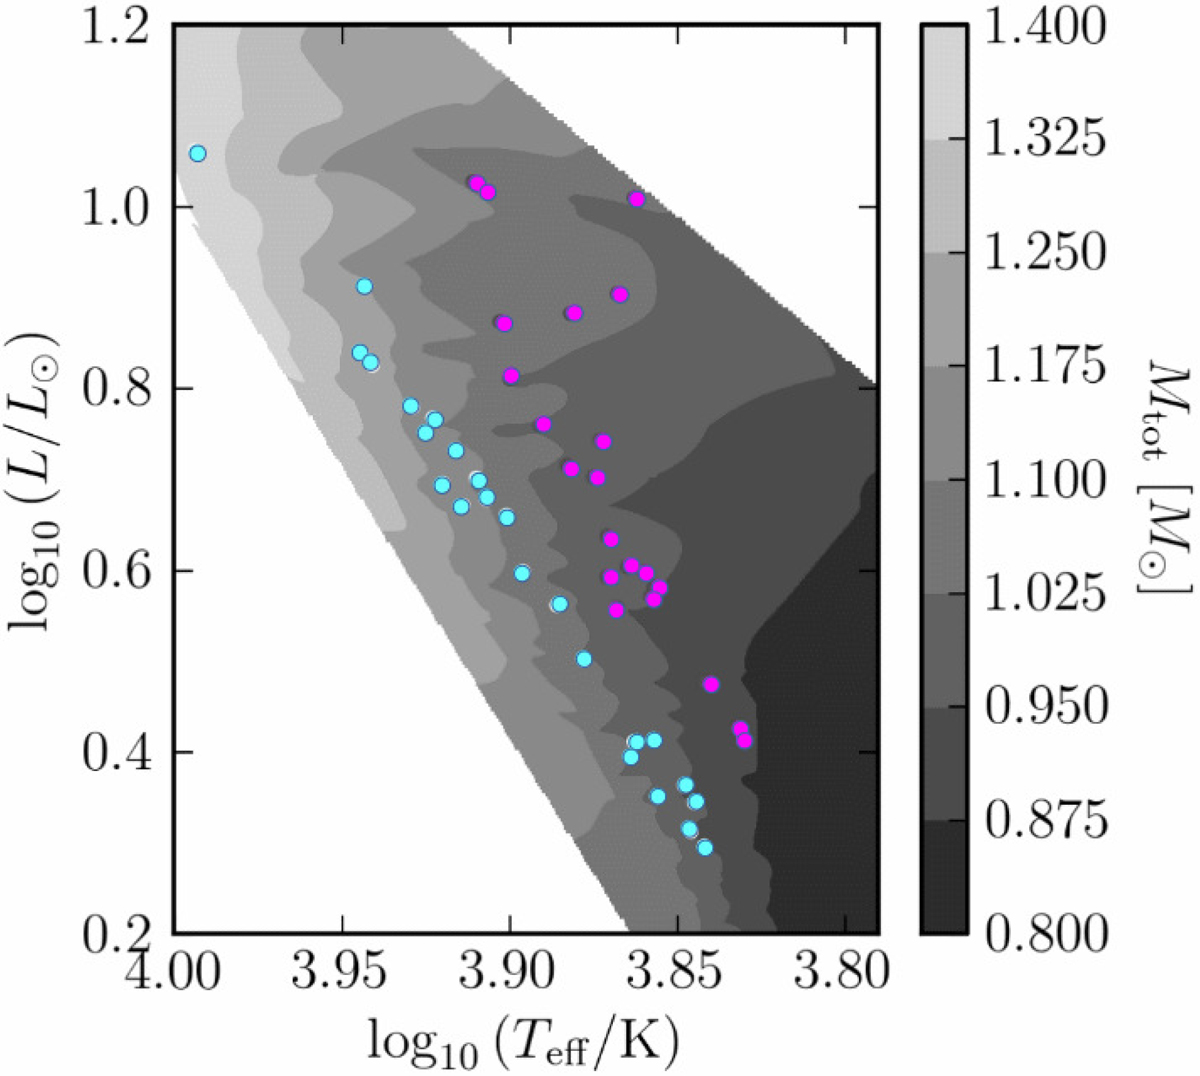
Hertzsprung–Russell diagram of the M30 blue stragglers. The original data from Ferraro et al. (2015) were convoluted to the temperature-luminosity plane. With effective temperature and luminosity from Ferraro et al. (2009). The blue and red blue stragglers are indicated as such.
Current usage metrics show cumulative count of Article Views (full-text article views including HTML views, PDF and ePub downloads, according to the available data) and Abstracts Views on Vision4Press platform.
Data correspond to usage on the plateform after 2015. The current usage metrics is available 48-96 hours after online publication and is updated daily on week days.
Initial download of the metrics may take a while.