Fig. 4
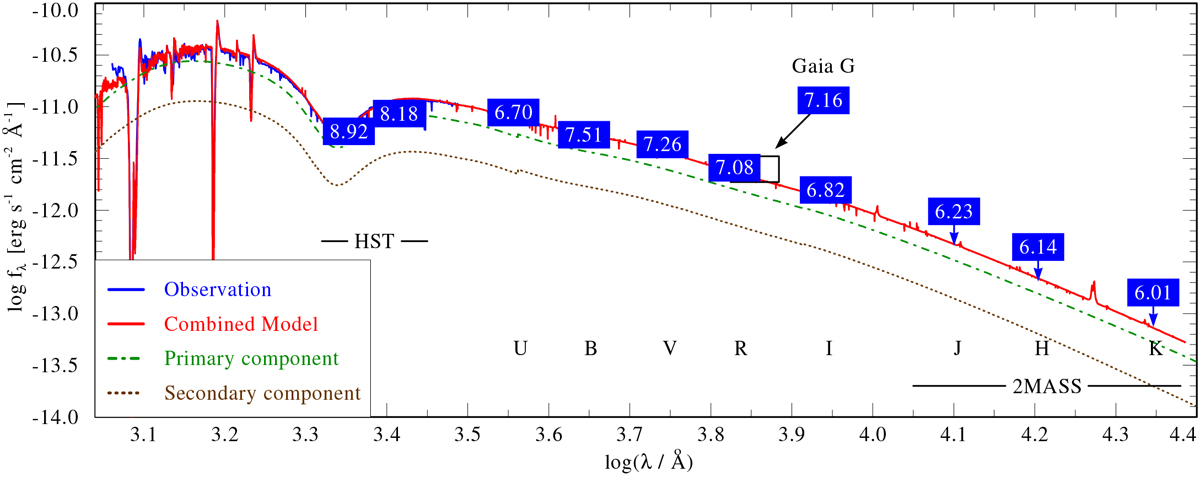
Comparison of the observed flux-calibrated UV spectrum (blue solid line) and the photometry (blue boxes with magnitudes imprinted) to the combined, diluted, and reddened synthetic SED (red solid line). The SEDs of the individual components are indicated by the green dash-dotted line (primary) and the brown dotted line (secondary), respectively. The excess in the IR is due to contamination of the 2MASS photometry by nearby stars, and thus only provides upper limits. The Gaia G and the Johnson R photometry overlap. For visibility, the Gaia photometry box is shifted. The black box and arrow indicate its actual position.
Current usage metrics show cumulative count of Article Views (full-text article views including HTML views, PDF and ePub downloads, according to the available data) and Abstracts Views on Vision4Press platform.
Data correspond to usage on the plateform after 2015. The current usage metrics is available 48-96 hours after online publication and is updated daily on week days.
Initial download of the metrics may take a while.