Fig. 20
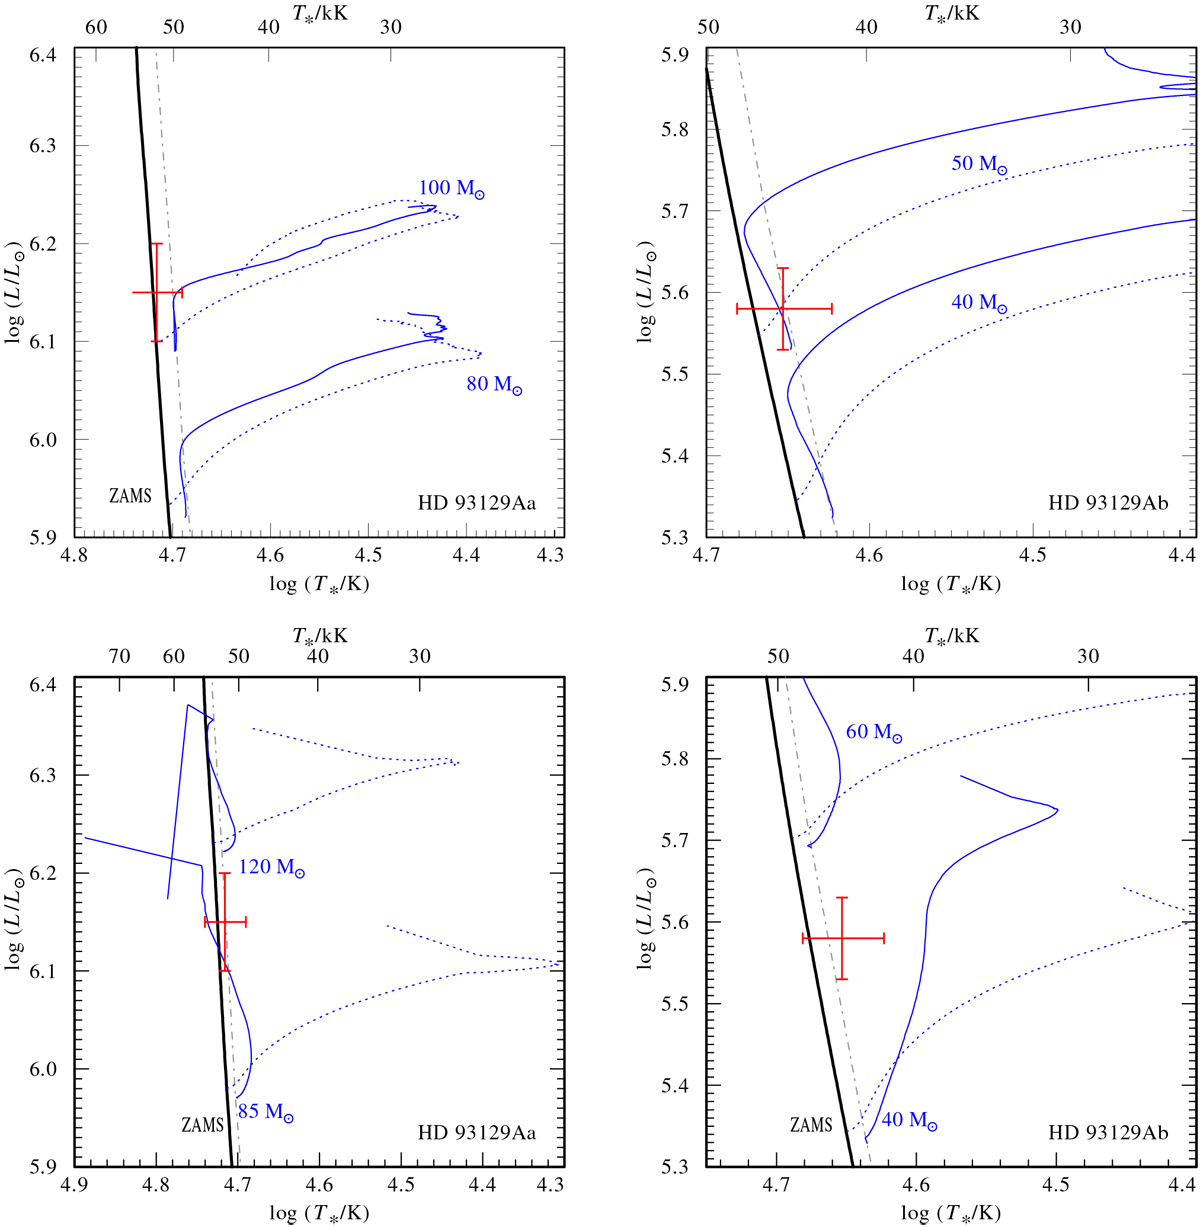
HRDs for Aa (left panels) and Ab (right panels) compared to the ZAMS (solid black and gray dashed lines for non-rotating and rotating stars, respectively) and evolutionary tracks calculated by Brott et al. (2011; upper panels) and Ekström et al. (2012; lower panels), respectively. The blue solid lines depict the tracks for non-rotating stars, and the blue dotted lines show tracks for rotating stars. All tracks show the pre-He burning phase. The positions of the components of HD 93129A from our analysis are shown in red.
Current usage metrics show cumulative count of Article Views (full-text article views including HTML views, PDF and ePub downloads, according to the available data) and Abstracts Views on Vision4Press platform.
Data correspond to usage on the plateform after 2015. The current usage metrics is available 48-96 hours after online publication and is updated daily on week days.
Initial download of the metrics may take a while.