Free Access
Fig. 15
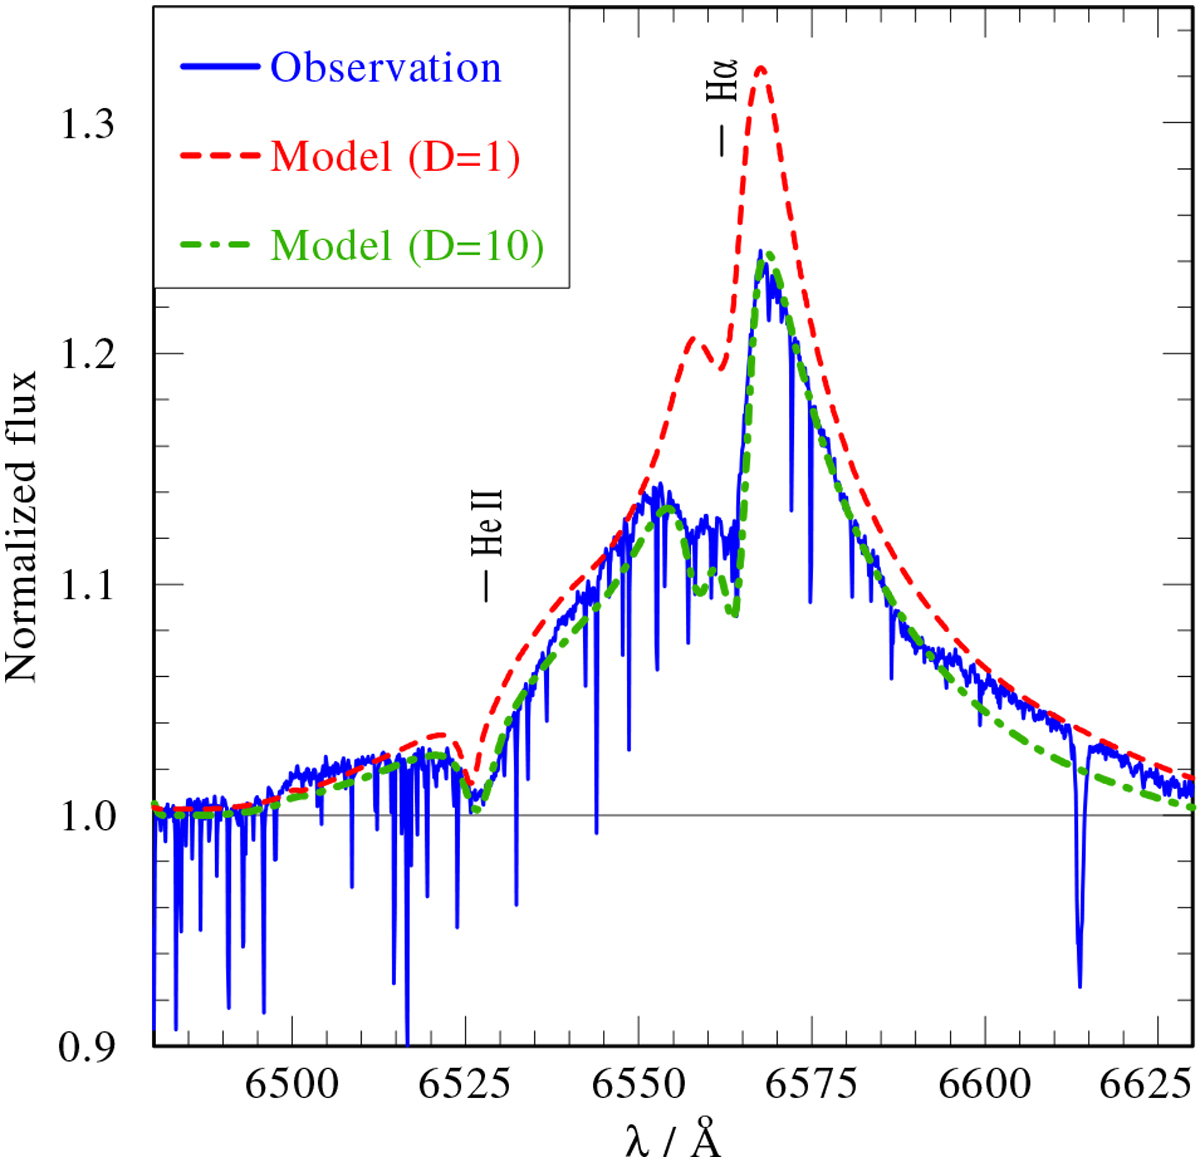
Observed Hα (blue solid line) compared to the final composite model with D = 1 for the primary (dashed red line) and a composite model with radial dependent D as displayedby the red dashed line in Fig. 14 (dash-dotted green line).
Current usage metrics show cumulative count of Article Views (full-text article views including HTML views, PDF and ePub downloads, according to the available data) and Abstracts Views on Vision4Press platform.
Data correspond to usage on the plateform after 2015. The current usage metrics is available 48-96 hours after online publication and is updated daily on week days.
Initial download of the metrics may take a while.