Fig. 13
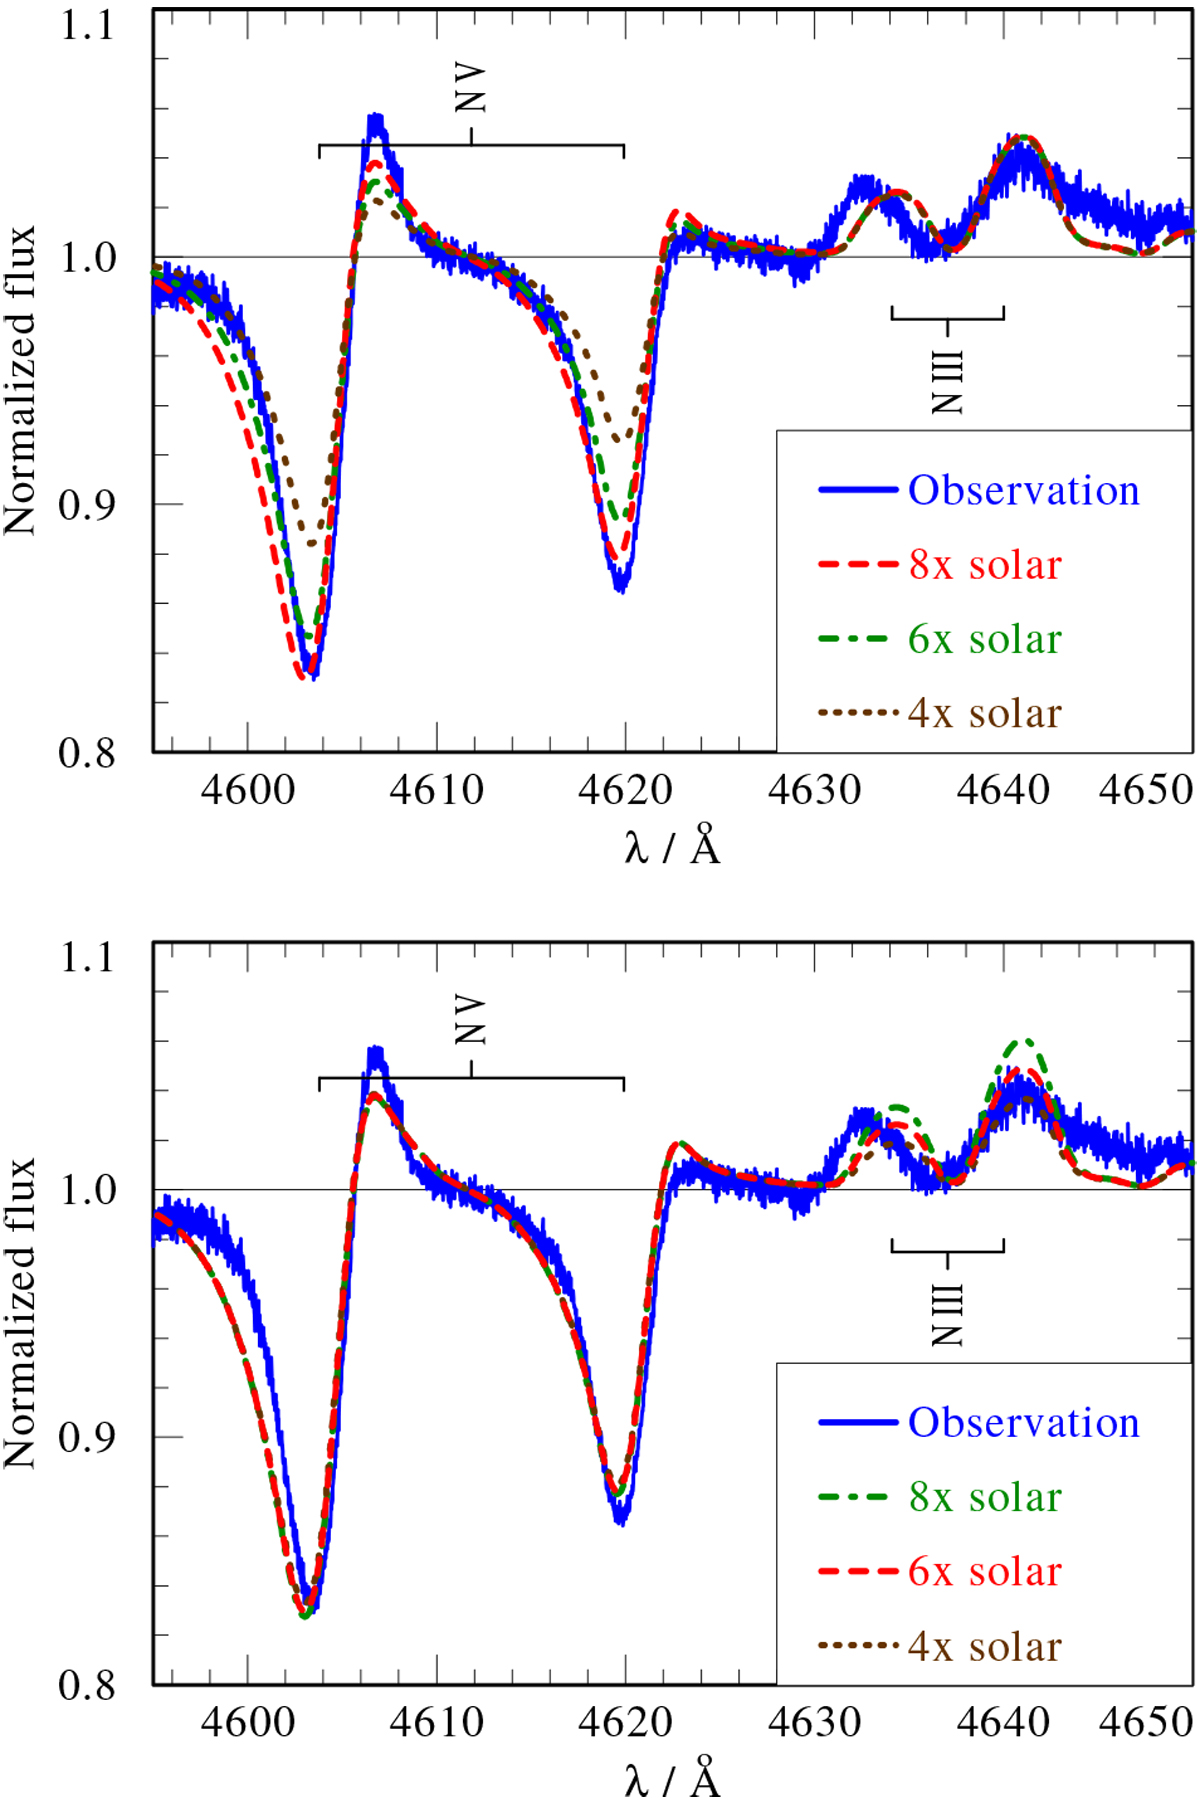
Observed N V λλ4603, 4619 and N III λλ4634, 4640 (blue solid line) compared to best-fitting model composition. In the upper panel, the nitrogen abundance of the primary is varied, while the secondary’s nitrogen abundance is kept at six times solar. In the lower panel, the secondary’s nitrogen abundance is varied, while the primary’s nitrogen abundance is kept at eight times solar. The red dashed lines indicate the final model.
Current usage metrics show cumulative count of Article Views (full-text article views including HTML views, PDF and ePub downloads, according to the available data) and Abstracts Views on Vision4Press platform.
Data correspond to usage on the plateform after 2015. The current usage metrics is available 48-96 hours after online publication and is updated daily on week days.
Initial download of the metrics may take a while.