Fig. A.1.
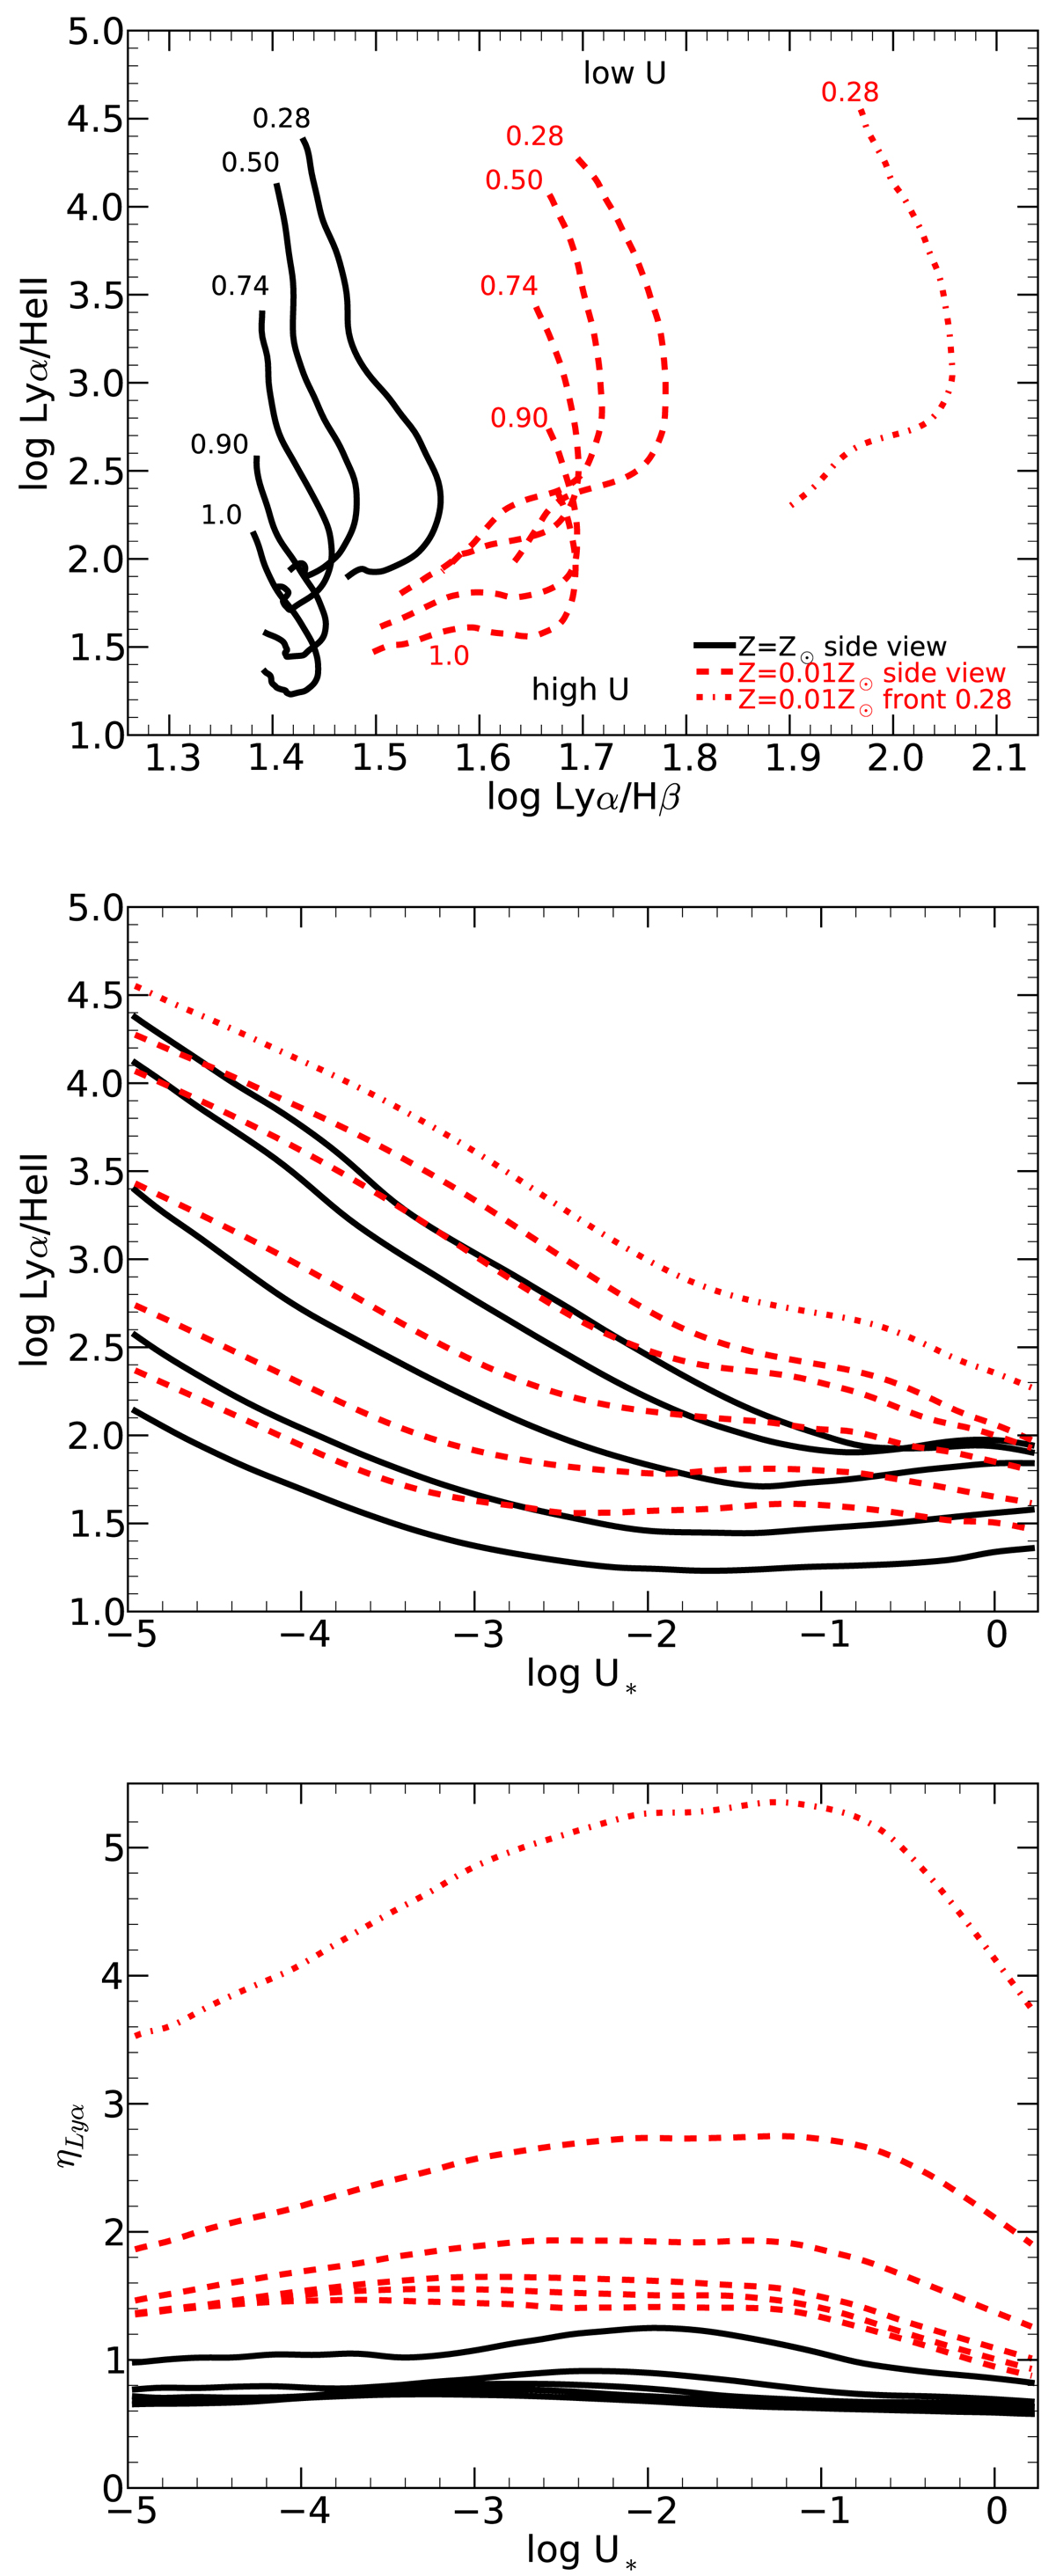
Impact of using a filtered ionizing continuum instead of a simple powerlaw on the observed values of Lyα/HeII, Lyα/Hβ and ηLyα. In order that the curves be aligned, the models are plotted as a function of log U* where U* = U/Fesc. In the upper panel, the U*-sequences using a filtered ionizing continuum are labelled with their respective value of Fesc. U*-sequence loci which use our default powerlaw of α = −1.5 are labelled “1.0” because the input SED is unfiltered. The dot-dashed curve (on the right of the upper panel) shows the locus of our sequence in U* that uses Fesc = 0.28, Z/Z⊙ = 0.01, α = −1.5 and the “front view”, to illustrate the combined effect of low U*, low gas metallicity, a heavily filtered ionizing continuum, and a “back-mirror”. For each combination of U* and Z/Z⊙, a lower Fesc results in a lower Lyα/HeII.
Current usage metrics show cumulative count of Article Views (full-text article views including HTML views, PDF and ePub downloads, according to the available data) and Abstracts Views on Vision4Press platform.
Data correspond to usage on the plateform after 2015. The current usage metrics is available 48-96 hours after online publication and is updated daily on week days.
Initial download of the metrics may take a while.