Fig. 7.
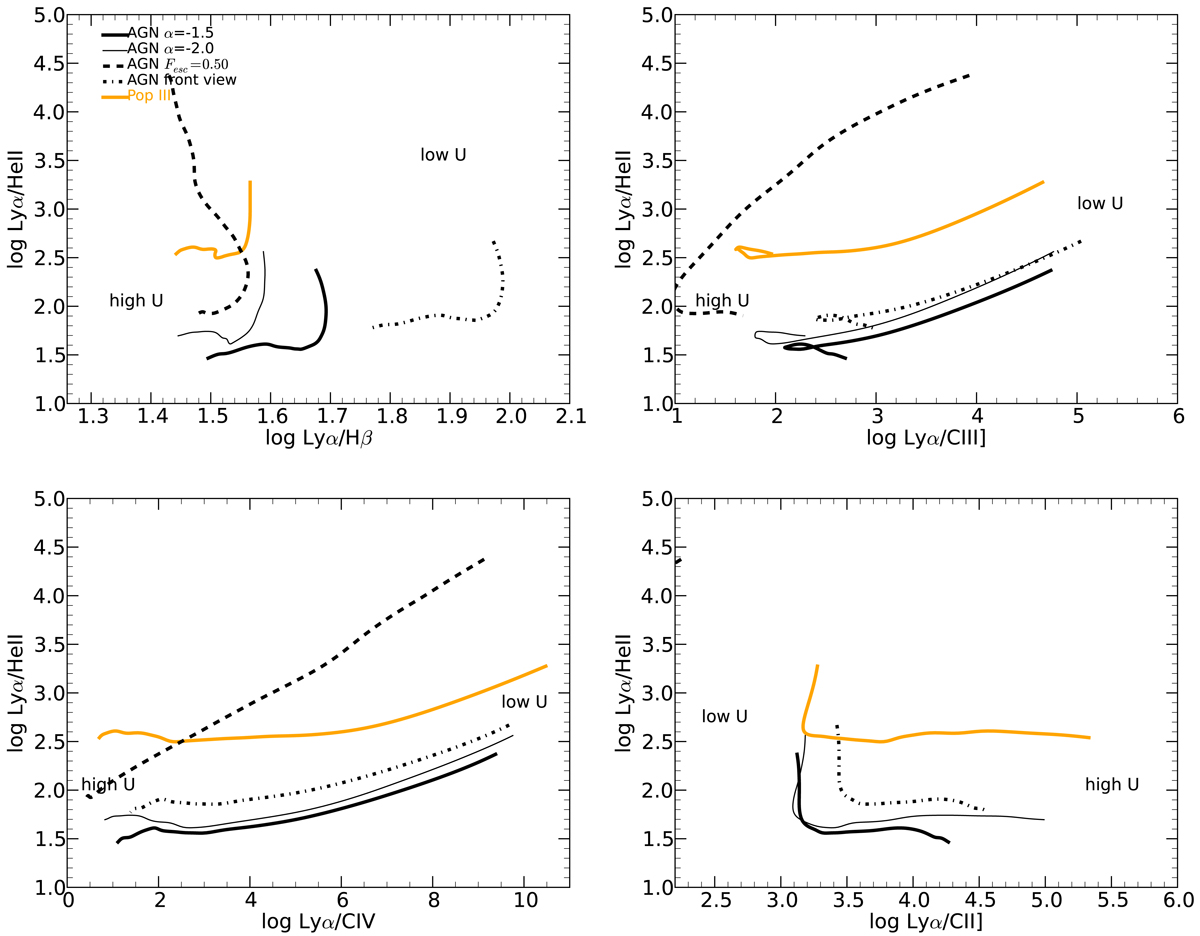
Diagnostic diagrams comparing Pop III (heavy orange line) and several AGN photoionization models. The AGN model U-sequences shown here are: α = −1.5 (thick black line); α = −2.0 (thin black line); α = −1.5 with “front view” (“back-mirror”) (dot-dashed line); photoionization by our Fesc filtered AGN continuum (dashed line). All models shown in this figure use Z/Z⊙ = 0.01. See main text for further details. The model loci cover the full range of ionization parameter in our model grid, i.e., −5.55 < log U < 0.25.
Current usage metrics show cumulative count of Article Views (full-text article views including HTML views, PDF and ePub downloads, according to the available data) and Abstracts Views on Vision4Press platform.
Data correspond to usage on the plateform after 2015. The current usage metrics is available 48-96 hours after online publication and is updated daily on week days.
Initial download of the metrics may take a while.