Fig. 1.
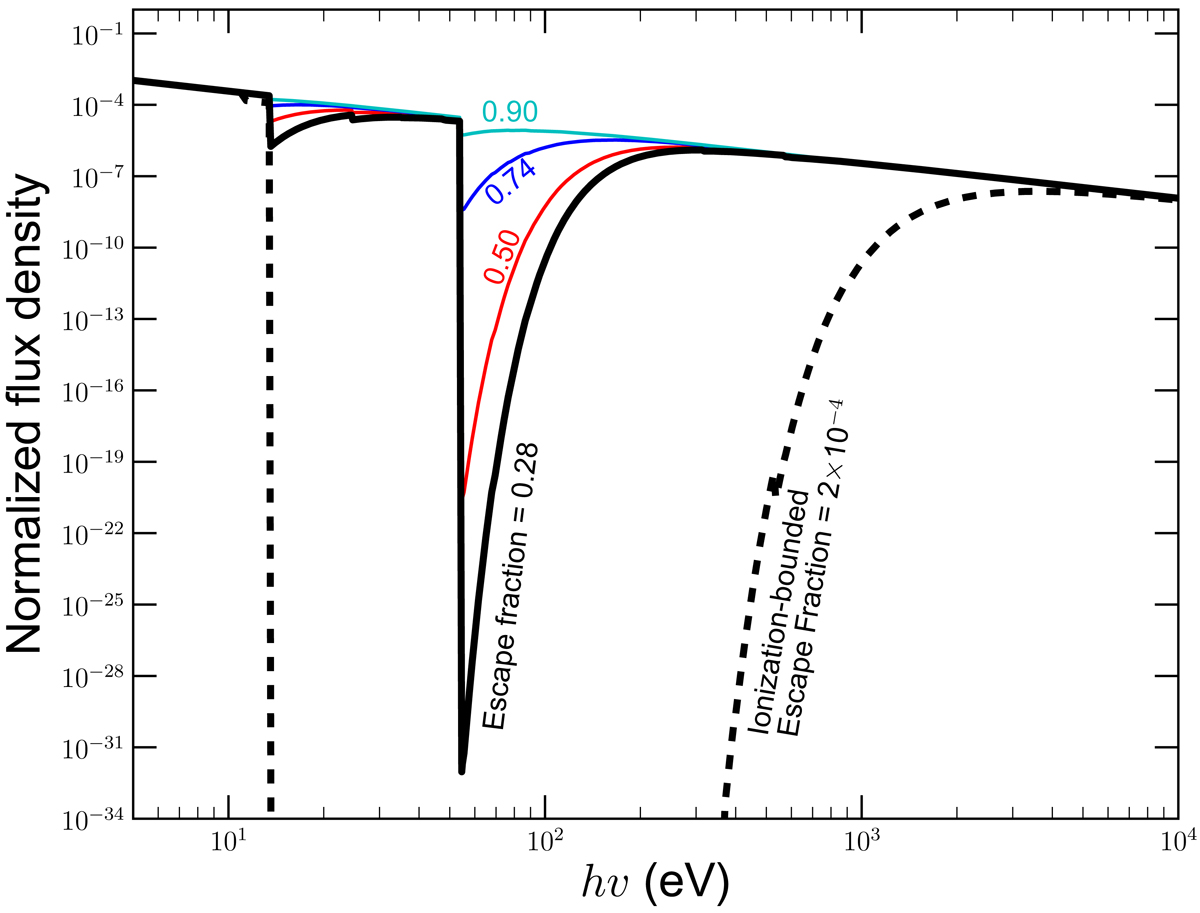
Filtered AGN spectral energy distributions described in Sect. 3.8. These correspond to escape fractions of 0.28 (solid black line), 0.50 (solid red line), 0.74 (solid blue line) and 0.90 (solid cyan line). For comparison, we also show the emergent distribution from a typical ionization-bounded model (dashed black line): the UV part of the spectrum has been completely absorbed, while some X-rays still escape through the cloud. The vertical axis (normalized flux density or Sν) gives the power per unit area per unit frequency in arbitrary units. The escape fractions are in photon number flux, while the SEDs are plotted in energy flux per unit frequency (Sν).
Current usage metrics show cumulative count of Article Views (full-text article views including HTML views, PDF and ePub downloads, according to the available data) and Abstracts Views on Vision4Press platform.
Data correspond to usage on the plateform after 2015. The current usage metrics is available 48-96 hours after online publication and is updated daily on week days.
Initial download of the metrics may take a while.