Fig. 6.
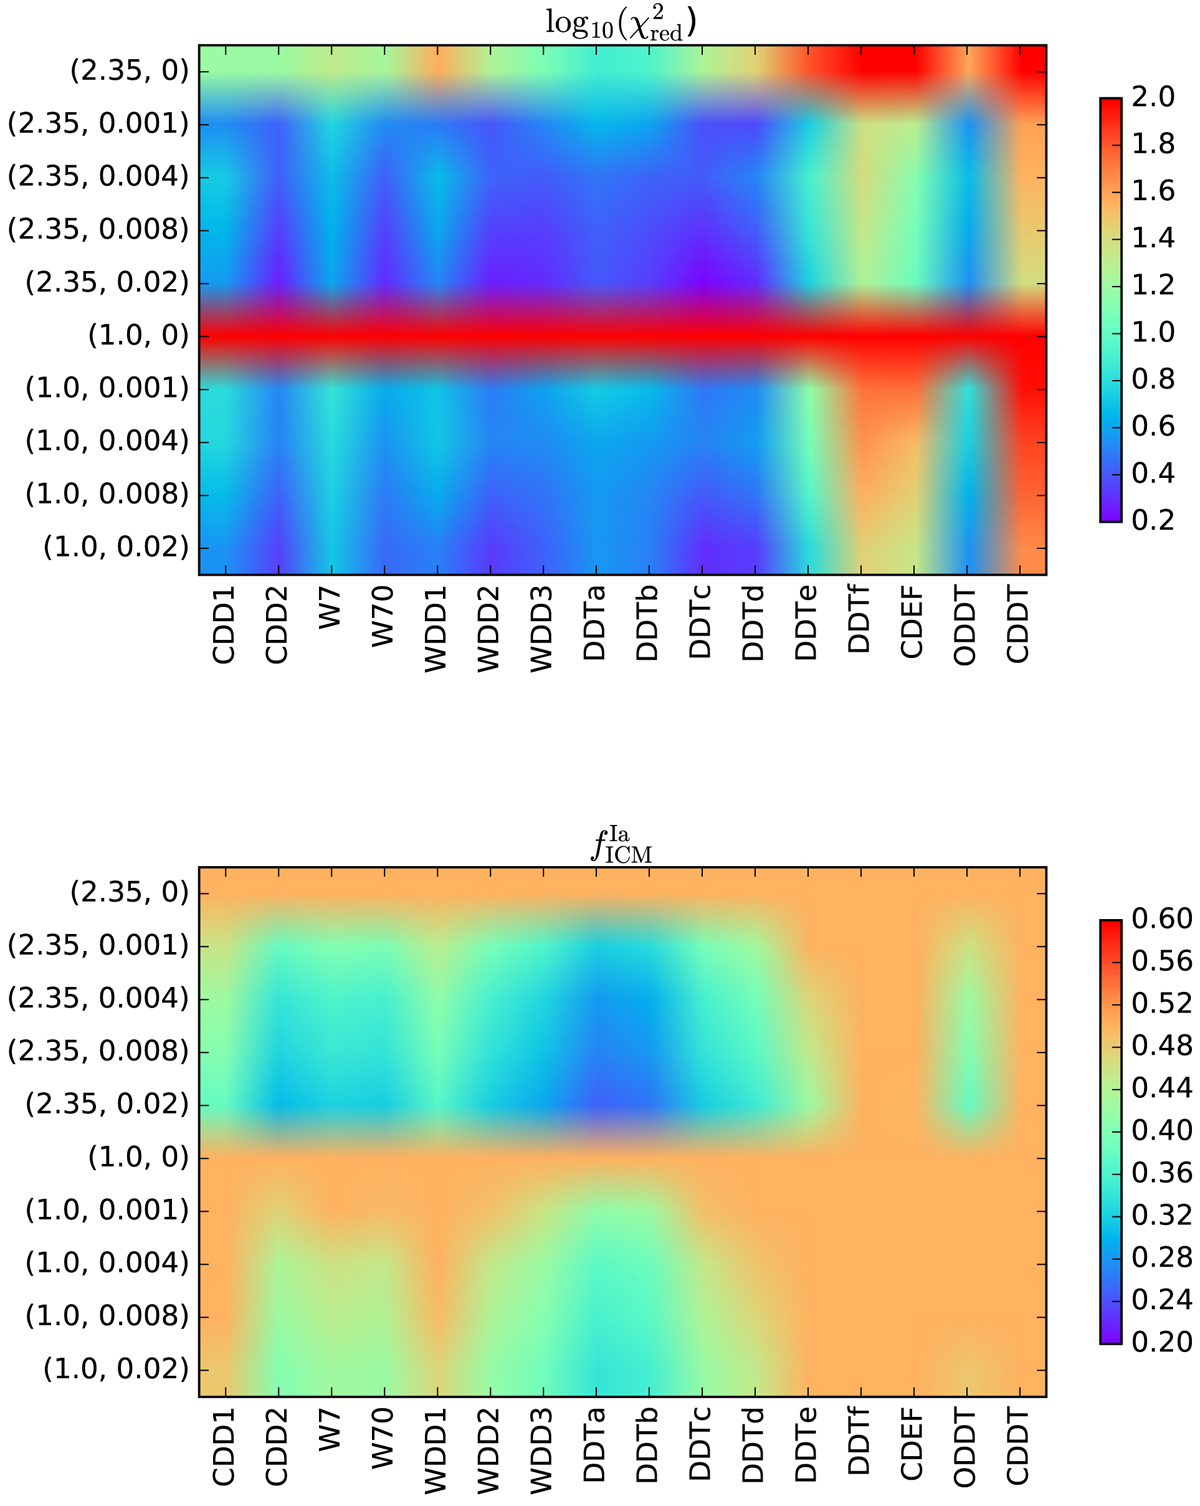
Colour map of reduced chi-squared (χ2/d.o.f. in log10 scale, upper panel) and SNIa fraction (![]() , lower panel) for 10 × 16 combinations of yields we considered to fit the abundance ratios in NGC 5044, without N/Fe (d.o.f. = 7). The X-axis labels indicate the SNIa models. The Y-axis labels indicate IMF power-law index and the initial metallicity of the stellar populations.
, lower panel) for 10 × 16 combinations of yields we considered to fit the abundance ratios in NGC 5044, without N/Fe (d.o.f. = 7). The X-axis labels indicate the SNIa models. The Y-axis labels indicate IMF power-law index and the initial metallicity of the stellar populations.
Current usage metrics show cumulative count of Article Views (full-text article views including HTML views, PDF and ePub downloads, according to the available data) and Abstracts Views on Vision4Press platform.
Data correspond to usage on the plateform after 2015. The current usage metrics is available 48-96 hours after online publication and is updated daily on week days.
Initial download of the metrics may take a while.