Fig. 2.
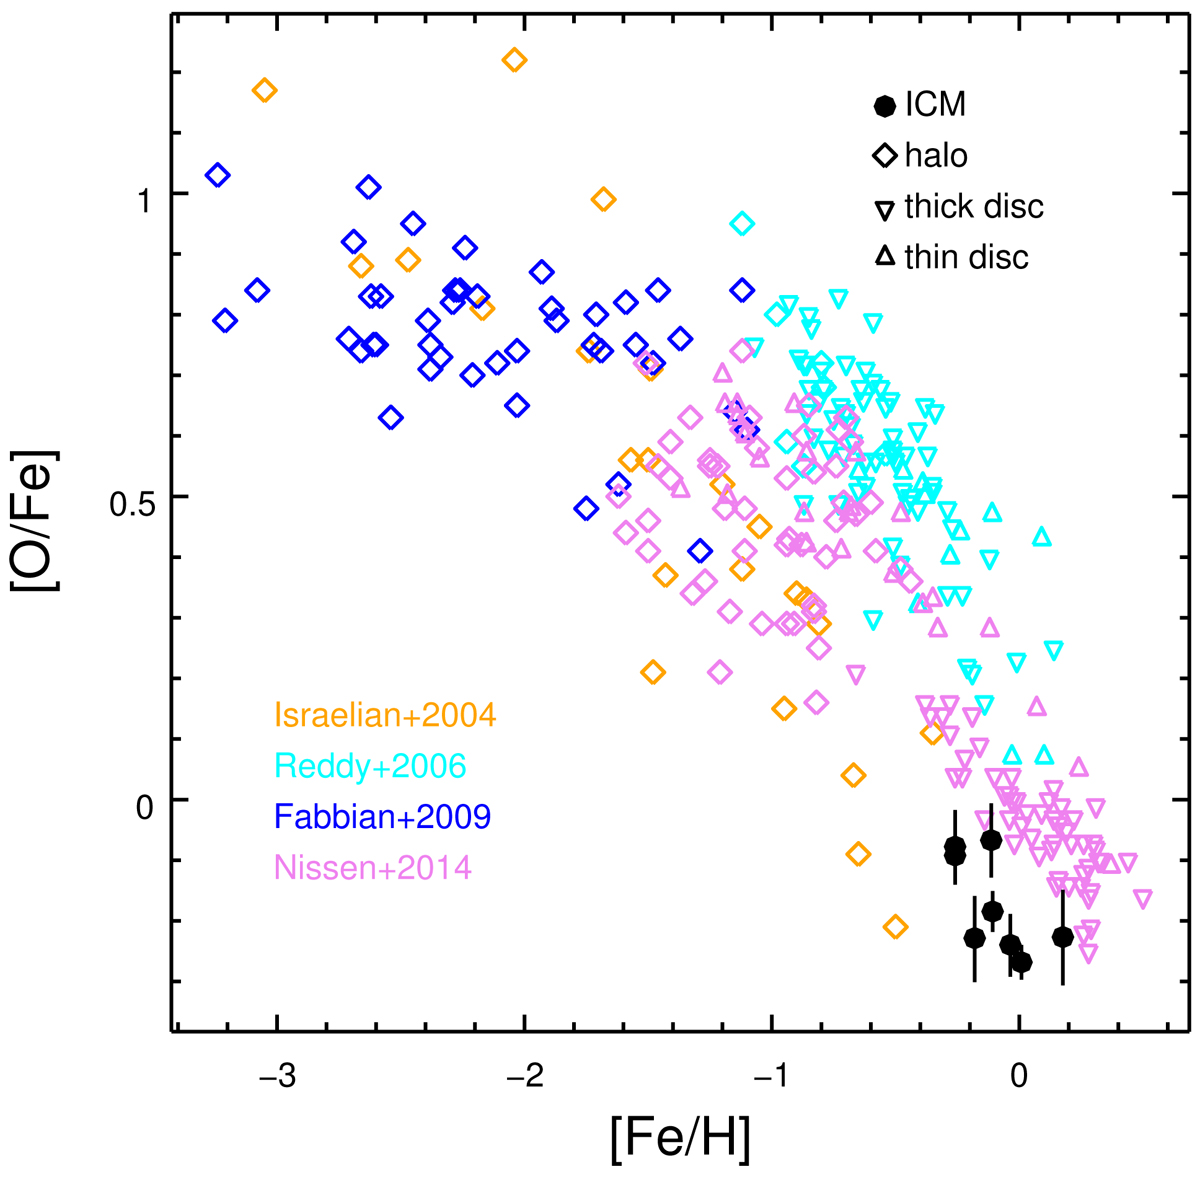
[O/Fe]–[Fe/H] relation for the ICM and the Galaxy. The ICM Fe abundances and O/Fe abundance ratios (Table 1) are shown as black dots with (statistical) error bars.The Galactic Fe abundances and O/Fe abundance ratios are taken from Israelian et al. (2004; halo, orange), Reddy et al. (2006; disc and halo, cyan), Fabbian et al. (2009; halo, blue), and Nissen et al. (2014; disc and halo, pink).
Current usage metrics show cumulative count of Article Views (full-text article views including HTML views, PDF and ePub downloads, according to the available data) and Abstracts Views on Vision4Press platform.
Data correspond to usage on the plateform after 2015. The current usage metrics is available 48-96 hours after online publication and is updated daily on week days.
Initial download of the metrics may take a while.