Fig. B.4.
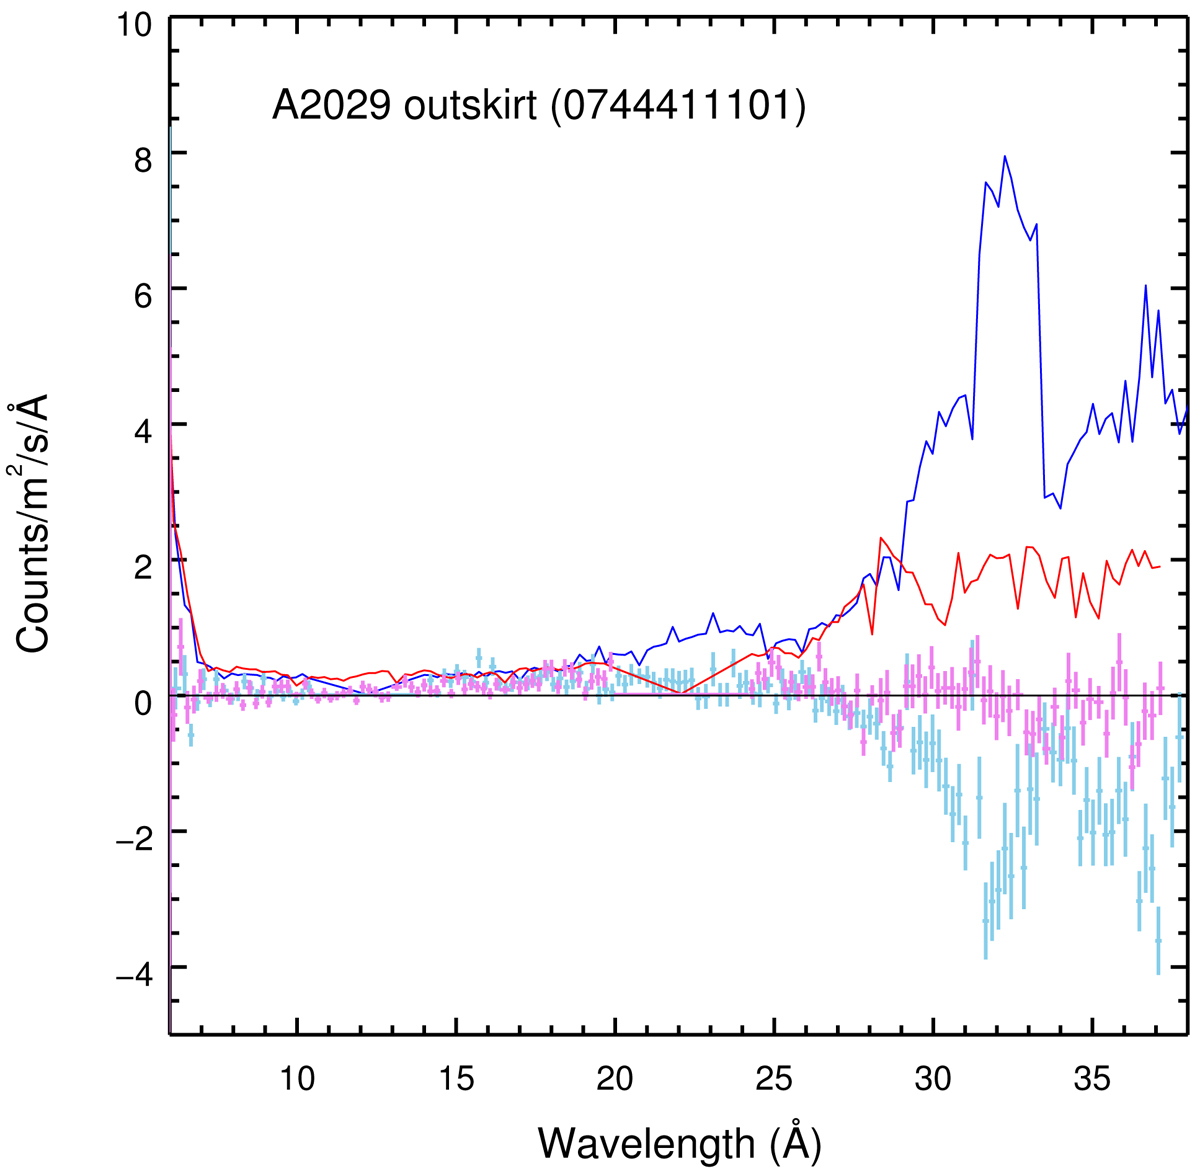
RGS first-order spectra of the A 2029 outskirt (ObsID: 0744411001). The data with error bars (light blue for RGS1 and violet for RGS2) are the observed background spectra minus the modelled background spectra, which are expected to be around zero if the modelled background spectra are accurate. The solid lines (deep blue for RGS1 and red for RGS2) are the (subtracted) modelled background spectra obtained with rgsproc.
Current usage metrics show cumulative count of Article Views (full-text article views including HTML views, PDF and ePub downloads, according to the available data) and Abstracts Views on Vision4Press platform.
Data correspond to usage on the plateform after 2015. The current usage metrics is available 48-96 hours after online publication and is updated daily on week days.
Initial download of the metrics may take a while.