Fig. 1.
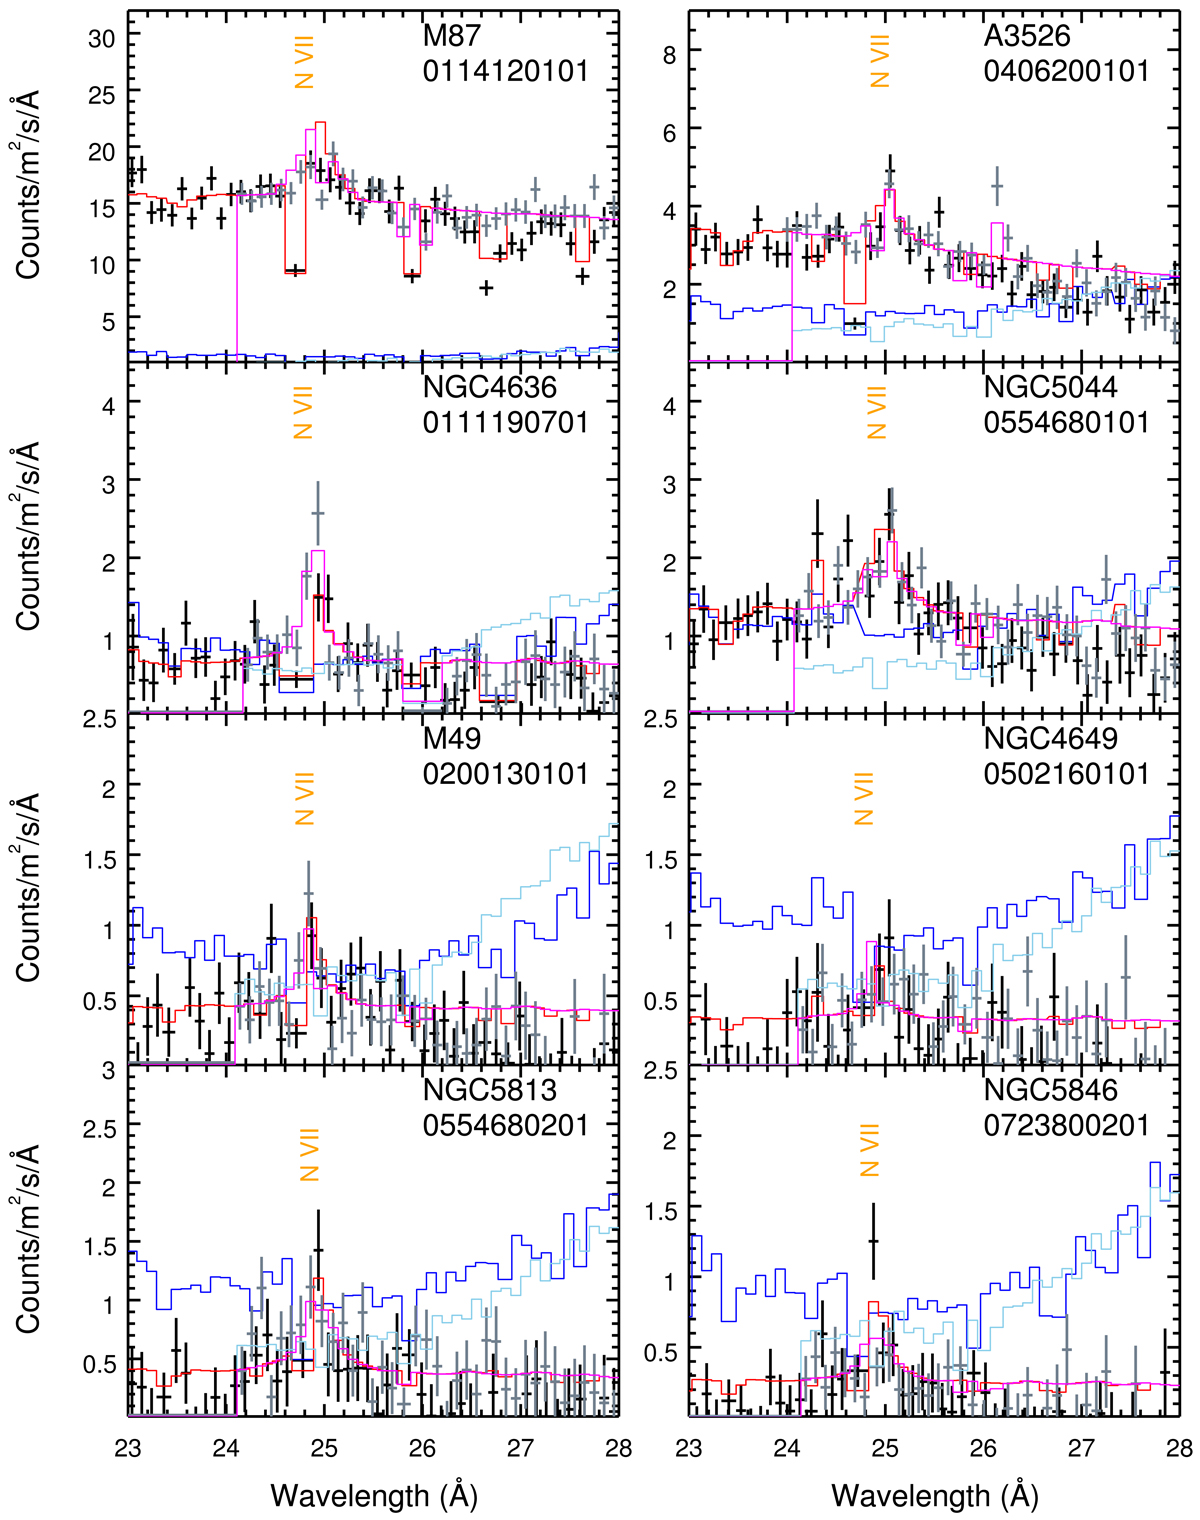
Observed RGS spectra in the N VII neighbourhood, i.e., 23–28 Å wavelength range. The data points are shown in black (RGS1) and grey (RGS2), the modelled background spectra are shown in deep blue (RGS1) and light blue (RGS2) histograms, and the (global fit) model spectra are shown in red (RGS1) and magenta (RGS2) histograms. Vertical dashed lines indicate the O VIII Lyα around 19 Å and N VII Lyα around 25 Å in the observed frame. Spectra from merely one observation per target are shown for clarity. In the global fit to M 87 (top left panel), the N abundance is clearly overestimated, thus a local fit is performed (Sect. 3) to obtain a more accurate abundance measurement.
Current usage metrics show cumulative count of Article Views (full-text article views including HTML views, PDF and ePub downloads, according to the available data) and Abstracts Views on Vision4Press platform.
Data correspond to usage on the plateform after 2015. The current usage metrics is available 48-96 hours after online publication and is updated daily on week days.
Initial download of the metrics may take a while.