| Issue |
A&A
Volume 620, December 2018
|
|
|---|---|---|
| Article Number | L9 | |
| Number of page(s) | 4 | |
| Section | Letters to the Editor | |
| DOI | https://doi.org/10.1051/0004-6361/201834604 | |
| Published online | 06 December 2018 | |
Letter to the Editor
Identifying blue large-amplitude pulsators in the Galactic plane using Gaia DR2: a case study
Armagh Observatory and Planetarium, College Hill, Armagh, BT61 9DG, UK
e-mail: This email address is being protected from spambots. You need JavaScript enabled to view it.
Received:
8
November
2018
Accepted:
23
November
2018
Abstract
Blue large-amplitude pulsators (BLAPs) are blue stars emitting high-amplitude (> 0.2 mag) pulsations on a timescale of a few tens of minutes. Recently discovered using OGLE data, they form a new class of variable star and have inspired a number of investigations searching for the origin of their pulsations. This short study presents the Gaia DR2 data for ten BLAPs for which parallax measurements are available. We have dereddened their colours using Gaia DR2 data from the stars in their immediate field and find that six show absolute magnitude and intrinsic colour consistent with expectations, whilst four stars have a less certain classification. This work highlights the extra information that Gaia DR2 data can provide to help classify those variable stars for which moderate-resolution optical spectra are not currently available. We also show how Gaia DR2 can make searches for BLAPs in wide-field high-cadence surveys more systematic and robust.
Key words: stars: oscillations / stars: distances / white dwarfs / dust / extinction
© ESO 2018
1. Introduction
In the last few decades there has been a rapid increase in the number of wide-field photometric surveys leading to the discovery of hundreds of thousands of new Galactic variable stars as well as transient events originating from nearby stars and supernovae at cosmological distances. Many of these discoveries have been variable stars of well-known types. For instance, Alcock et al. (1998) used MACHO data to identify 1800 RR Lyr stars located in the Galactic bulge which were used as tracers of Galactic structure. More recently, the All-Sky Automated Survey for Supernovae (ASAS-SN; Shappee et al. 2014) allowed for the discovery of rare objects, such as the ultra-compact AM CVn binaries (e.g. Campbell et al. 2015).
These surveys have also led to the discovery of new types of variable stars. One such discovery has come from the Optical Gravitational Lensing Experiment (Udalski et al. 2015, OGLE). This new type has been dubbed blue large-amplitude pulsators (BLAPs). Pietrukowicz et al. (2017) announced the discovery of more than a dozen blue stars which display a periodic variation in the light curve on a period between 20 and 40 min and with an amplitude of 0.2–0.4 mag. Their folded light curve is very similar to the well-known Cepheid and RR Lyr stars although with a much shorter period.
Pietrukowicz et al. (2017) obtained moderate-resolution spectroscopy of one of their targets and determined a temperature of ∼30 000 K. Lower-resolution spectra were obtained for a further three sources. They have colours which are bluer compared to the upper main sequence. What makes BLAPs interesting is that it is difficult for stars to pulsate on such a short timescale and with a high amplitude. Pietrukowicz et al. (2017) indicate that oscillations could be driven in low-mass stars which have an inflated helium-enriched envelope, while Romero et al. (2018) propose they are the hot counterparts of stars which are the progenitors of extremely low-mass white dwarfs. Byrne & Jeffery (2018) tested whether post-common-envelope stars could be unstable and have the observed properties of the BLAPs and find that stars with 0.31 M⊙ could be their origin.
Given the interest of BLAPs to the field of evolved stars and that wide field photometric surveys are likely to detect many more short-period variable stars, we have cross matched the available Gaia DR2 with the 14 BLAPs identified by Pietrukowicz et al. (2017) with a view to making future identifications of BLAPs more robust.
2. Gaia DR2
The Gaia Data Release 2 (DR2) on 25 April 2018 provided the parallax of 1.3 billion stars down to G ∼ 21 (Brown 2018a). It also provided other parameters such as proper motion and (BP − RP) colour, which is derived from the prism data. Of the 14 BLAPs identified by Pietrukowicz et al. (2017), 10 have a parallax in Gaia DR2. Every source was flagged as “Variable” apart from BLAP 4 which was recorded as having no variability information available. Since the sources are not expected to be in the immediate Solar neighbourhood, it is not surprising that the parallaxes (shown in Table 1) are small, with some even showing a negative parallax (an indication of a source being at a high but uncertain distance Astraatmadjam & Bailer-Jones 2016a).
Details of the BLAPs refered to in this study.
We convert parallax from the Gaia DR2 into distance following the guidelines from Bailer-Jones (2015), Astraatmadjam & Bailer-Jones (2016b) and Luri (2018b), who all take a Bayesian approach. In practise we use a routine in the STILTS package (Taylor 2006) and apply a scale length L = 1.35 kpc, which is the most appropriate for stellar populations in the Milky Way in general. For most sources, the lower limit for the distance is a few kiloparsecs with upper limits nearing 10 kpc. In Table 1 we also note the (BP − RP) colour. For two sources, 4 and 6, no (BP − RP) colour is given, so we take the V − I colour reported in Pietrukowicz et al. (2017) and convert to (BP − RP) using the transformations outlined in Evans et al. (2018).
The BLAPs reported in Pietrukowicz et al. (2017) lie within a few degrees of the Galactic plane: given that they are all at distances greater than a few kiloparsecs, the effects of extinction will be considerable and need to be removed. There are a number of resources to determine the extinction as a function of distance, including the three-dimensional dust maps derived from Pan-STARRS1 data (Green et al. 2018), and the maps of Capitanio et al. (2017) which were derived from a number of sources. However, there are issues with these maps since they provide E(B − V) rather than E(BP − RP) and in the case of Capitanio et al. (2017) do not extend further than 2 kpc.
We therefore extracted sources from Gaia DR2 within 0.25 degrees from each source. Ideally we would then find the relationship between distance and E(BP − RP),AG which are included in DR2 and derived from the work of the Apsis data-processing pipeline (see Andrae et al. 2018). Andrae et al. (2018) show that the relationship between E(B − V) and E(BP − RP) is dependent on the intrinsic colour of the source. We therefore extracted a subset from each dataset to extract stars which had (BP − RP)o< 0.5 (which is what we expect for the BLAPs) and determined the relationship between distance and E(BP − RP). In most cases, we found a reasonable agreement between the values found using data from Gaia DR2 and the reddening maps mentioned earlier after making an approximate conversion from E(BP − RP) to E(B − V). As found by Andrae et al. (2018), we find the reddening AG ∼ 2 × E(BP − RP). To estimate the total error on (BP − RP)o we assumed an error of 20 percent on E(BP − RP) which was derived by assessing the distance – E(BP − RP) maps. The dereddend values for MG and (BP − RP) are shown in Table 1.
3. Results
The BLAPs identified by Pietrukowicz et al. (2017) are shown in the ((BP − RP), MG) “HR” diagram in Fig. 1 together with a density plot of stars in all directions within 150 pc, which we assume are little affected by interstellar reddening. Comparing the observed colours (shown as red dots) with the dereddened colours indicates that, as expected for stars in the Galactic plane, they are significantly affected by reddening. However, although all the BLAPs are bluer than the main sequence, there is a marked spread in the HR diagram.
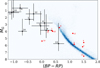 |
Fig. 1. Unreddened (BP − RP), MG colour-absolute magnitudes for the BLAPs, as identified by Pietrukowicz et al. (2017), are shown as red points, and the dereddened colour-absolute magnitudes are shown in black where the errors reflect the uncertainty on the distance and (BP − RP) colour, with an additional 20 percent uncertainty on the extinction. The background shows the density of stars in the (BP − RP), MG plane of stars within 150 pc, which are assumed not to be significantly affected by reddening. |
Pietrukowicz et al. (2017) presented moderate-resolution optical spectra of star 1 and low-resolution spectra of stars 9, 11, and 14. They determine a temperature for these stars within a relatively narrow range (Teff ∼ 30 000 ± 2500 K) and log g ∼ 4.4 ± 0.2. These stars together with stars 10 and 12 have an intrinsic colour (BP − RP)o < −0.5. Stars 3, 4, and 6 are redder ((BP − RP)o ∼ 0.0) and star 13 is significantly redder and fainter than those.
Andrae et al. (2018) present a detailed examination of how reliable stellar temperature and reddening can be determined from Gaia DR2 data. Although there is a degeneracy between temperature and reddening over certain temperature ranges, they find that for known white dwarfs with Teff ≈ 30 000 K, (BP − RP)≈ − 0.4. Although there is considerable uncertainty on the distance (and to a lesser extent the reddening) of the BLAPs studied here, we find that stars 1, 9, 10, 11, 12, and 14 have an implied temperature consistent with the temperature of BLAPs derived from spectra and an absolute magnitude consistent with theoretical predictions (Byrne & Jeffery 2018).
In contrast, stars 3, 4, and 6 are redder and fainter. Comparing the HR diagram of different classes of variable stars made using Gaia DR2 data (Eyer 2018c) with Fig. 1, these stars lie in the same part of the HR diagram as pulsating white dwarfs and sub-dwarf B stars. Both of these variable star classes can show periods on the same timescale as those found by Pietrukowicz et al. (2017) for these stars (28.5, 22.4, and 38.0 min). On the other hand, Star 13 is fainter and redder and lies in the same part of the HR diagram as the accreting cataclysmic variables (CVs).
To investigate this further we compared the observed period of modulation (see Table 1) with MGo and (BP − RP)o. Whilst there is no correlation between period and MGo, we show in Fig. 2 the relationship between period and (BP − RP)o. Stars 13 and 6 show the longest periods (39.3 and 38.0 min, respectively) and the reddest colours. Star 4 has the shortest period (22.4 min) with a colour similar to star 6. The other stars, with the possible exception of star 3 which is slightly redder, share a similar location in the distribution. This is further evidence that stars 13, 4, and 6 have different properties compared to the others.
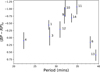 |
Fig. 2. Dereddened (BP − RP)o colour for the BLAP sample as a function of period (taken from Pietrukowicz et al. 2017). Figure 1 suggests that the physical characteristics of stars 4, 6, and 13, which are at the extreme ends of the period distribution, may differ from the other stars identified as BLAPs. |
Byrne & Jeffery (2018) give predictions for the dominant pulsation period as a function of temperature for two masses and three types of model. For their preferred mass (0.31 M⊙), one of their models (the “basic” model) predicts that shorter periods will be driven from hotter stars. The two other models (“standard” and “complete”) have two “loops” going through the region where pulsations are predicted to be driven: one track where shorter periods have higher temperatures, and the other with the reverse. Given the error on the (BP − RP) colours (Fig. 2) we cannot favour either of the models.
Although there are many known types of blue variable stars, very few show such a large amplitude on such a short period – one of the reasons why BLAPs have received such interest. For instance, although sub-dwarf B stars can show pulsations on a similar timescale, they show amplitudes typically of a few to tens of millimags. In contrast, white dwarfs can show a wide range of pulsation amplitudes. Indeed, one of the first white dwarf pulsators to be discovered, HL Tau 76 (Landolt 1968), was almost certainly discovered because of its high amplitude (0.2 mag). Cataclysmic variables show variability in period and amplitude, including orbital period, which can range from 5 min in the case of double degenerate binaries, to several hours for the more typical types. Star 13 shows a period of 39.3 min (Pietrukowicz et al. 2017) which would be too short for a hydrogen-accreting CV. However, even if the folded light curves shown in Pietrukowicz et al. (2017) differ in detail, they all show a rapid rise to flux maximum followed by a more gradual decline; they are very similar to δ Sct-, RR Lyr-, and δ Cep-type variable stars (albeit with much shorter periods) but unlike the light curves of hydrogen-deficient CVs or indeed white dwarfs, and so are likely to be stellar pulsators. How similar they are to the BLAPs however remains to be seen.
4. Conclusions
In this study we have dereddended the colours of the BLAPs reported in Pietrukowicz et al. (2017) using the reddening–distance relationship of stars in their immediate field. We find that six of the ten BLAPs for which parallax information is available have absolute magnitudes and intrinsic colours that are consistent with the temperature derived from those BLAPs for which optical spectra are available and for which theoretical predictions have been made. Four stars have properties which appear different and these may be other types of pulsating variables. To determine their nature, optical spectra of these stars is a priority.
The large number of wide-field optical surveys searching for transients and variable stars are identifying rare or new types of variable star. For stars near the Galactic plane the effects of reddening can make it difficult to determine the nature of a new variable star, mainly because their intrinsic colours can be very different to the observed colours.
The OmegaWhite survey is a high-cadence, wide-field photometric survey which has covered 400 square degrees of the Galactic plane (Macfarlane et al. 2015) and is identifying thousands of new short-period variables (Toma et al. 2016). Whilst for some of these fields VPHAS+ multi-colour data (Drew et al. 2014) are available, helping to identify their nature, for fields with high reddening the colours of compact stars can be blended with the population of unreddened main sequence stars. Gaia DR2 delivers information where the effects of reddening can be removed at least to first order for each OmegaWhite field (one square degree). It is therefore possible to select short-period variable stars with high amplitudes, which is more complete and robust than would otherwise be the case. This study highlights the information which Gaia DR2 can provide for characterising and classifying variable stars for which no or only low-resolution optical spectra are available.
Acknowledgments
This work has made use of data from the European Space Agency (ESA) mission Gaia (https://www.cosmos.esa.int/gaia) processed by the Gaia Data Processing and Analysis Consortium (DPAC, https://www.cosmos.esa.int/web/gaia/dpac/consortium). Funding for the DPAC has been provided by national institutions, in particular the institutions participating in the Gaia Multilateral Agreement. Armagh Observatory and Planetarium is core funded by the Northern Ireland Executive through the Dept for Communities. I thank Pasi Hakala for useful comments on an earlier draft of this paper and an anonymous referee for useful comments on the submitted paper.
References
- Alcock, C., Allsman, R. A., Alves, D., et al. 1998, ApJ, 492, 190 [NASA ADS] [CrossRef] [Google Scholar]
- Andrae, R., Fouesneau, M., Creevey, O., et al. 2018, A&A, 616, A8 [NASA ADS] [CrossRef] [EDP Sciences] [Google Scholar]
- Astraatmadjam, T. L., & Bailer-Jones, C. A. L. 2016a, ApJ, 832, 137 [NASA ADS] [CrossRef] [Google Scholar]
- Astraatmadjam, T. L., & Bailer-Jones, C. A. L. 2016b, ApJ, 833, 119 [NASA ADS] [CrossRef] [Google Scholar]
- Bailer-Jones, C. A. L. 2015, PASP, 127, 994 [NASA ADS] [CrossRef] [Google Scholar]
- Byrne, C. M., & Jeffery, C. S. 2018, MNRAS, 481, 3810 [NASA ADS] [CrossRef] [Google Scholar]
- Campbell, H. C., Marsh, T. R., Fraser, M., et al. 2015, MNRAS, 452, 1060 [NASA ADS] [CrossRef] [Google Scholar]
- Capitanio, L., Lallement, R., Vergely, J. L., et al. 2017, A&A, 606, A65 [NASA ADS] [CrossRef] [EDP Sciences] [Google Scholar]
- Drew, J. E., Gonzalez-Solares, E., Greimel, R., et al. 2014, MNRAS, 440, 2036 [NASA ADS] [CrossRef] [Google Scholar]
- Evans, D. W., Riello, M., De Angeli, F., et al. 2018, A&A, 616, A4 [NASA ADS] [CrossRef] [EDP Sciences] [Google Scholar]
- Gaia Collaboration (Brown, A. G. A., et al.) 2018a, A&A, 616, A1 [NASA ADS] [CrossRef] [EDP Sciences] [Google Scholar]
- Gaia Collaboration (Luri, X., et al.) 2018b, A&A, 616, A9 [NASA ADS] [CrossRef] [EDP Sciences] [Google Scholar]
- Gaia Collaboration (Eyer, L., et al.) 2018c, A&A, submitted [arXiv:1804.09382] [Google Scholar]
- Green, G. M., Schlafly, E. F., Finkbeiner, D., et al. 2018, MNRAS, 478, 651 [NASA ADS] [CrossRef] [Google Scholar]
- Landolt, A. U. 1968, ApJ, 153, 151 [NASA ADS] [CrossRef] [Google Scholar]
- Macfarlane, S. A., Toma, R., Ramsay, G., et al. 2015, MNRAS, 454, 507 [NASA ADS] [CrossRef] [Google Scholar]
- Pietrukowicz, P., Latour, M., Angeloni, R., et al. 2017, Nat. Astron., 1, 166 [NASA ADS] [CrossRef] [Google Scholar]
- Romero, A. D., Córsico, A. H., Althaus, L. G., et al. 2018, MNRAS, 477, L30 [NASA ADS] [CrossRef] [Google Scholar]
- Shappee, B. J., Prieto, J. L., Grupe, D., et al. 2014, ApJ, 788, 48 [NASA ADS] [CrossRef] [Google Scholar]
- Taylor, M. B. 2006, in Astronomical Data Analysis Software and Systems XV, eds. C. Gabriel,A. Christophe, P. Daniel, et al., ASPC, 351, 666 [Google Scholar]
- Toma, R., Ramsay, G., Macfarlane, S., et al. 2016, MNRAS, 463, 1099 [NASA ADS] [CrossRef] [Google Scholar]
- Udalski, A., Szymański, M. K., & Szymański, G. 2015, Acta Astron., 65, 1 [NASA ADS] [Google Scholar]
All Tables
All Figures
|
Fig. 1. Unreddened (BP − RP), MG colour-absolute magnitudes for the BLAPs, as identified by Pietrukowicz et al. (2017), are shown as red points, and the dereddened colour-absolute magnitudes are shown in black where the errors reflect the uncertainty on the distance and (BP − RP) colour, with an additional 20 percent uncertainty on the extinction. The background shows the density of stars in the (BP − RP), MG plane of stars within 150 pc, which are assumed not to be significantly affected by reddening. |
| In the text | |
|
Fig. 2. Dereddened (BP − RP)o colour for the BLAP sample as a function of period (taken from Pietrukowicz et al. 2017). Figure 1 suggests that the physical characteristics of stars 4, 6, and 13, which are at the extreme ends of the period distribution, may differ from the other stars identified as BLAPs. |
| In the text | |
Current usage metrics show cumulative count of Article Views (full-text article views including HTML views, PDF and ePub downloads, according to the available data) and Abstracts Views on Vision4Press platform.
Data correspond to usage on the plateform after 2015. The current usage metrics is available 48-96 hours after online publication and is updated daily on week days.
Initial download of the metrics may take a while.