Fig. 1
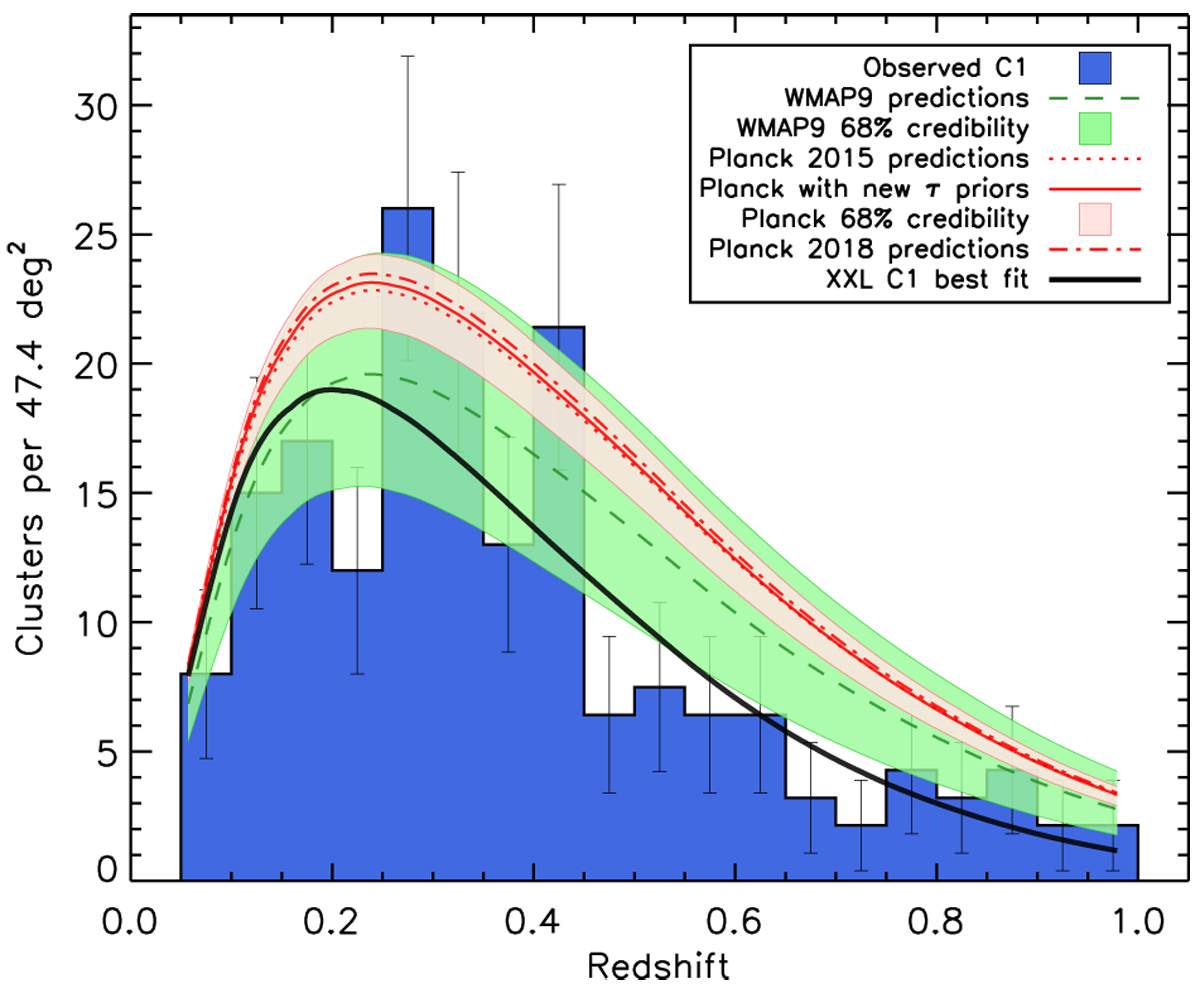
The histogram shows the observed redshift distribution of the 178 XXL C1 clusters used in the present study. Errors bars account for shot noise and sample variance following Valageas et al. (2011); the cluster deficit at z ~ 0.5 is present in both the XXL-N and XXL-S fields. Overlaid, the modelling obtained for different cosmologies assuming the cluster scaling relations of 1. The green line shows the prediction from the mean WMAP9 cosmology. The red dotted line corresponds to the Planck 2015 parameters (TT+lowTEB+lensing) of Planck Collaboration XIII (2016). The red full line shows the prediction from our reanalysis of the Planck 2015 data adopting the updated estimate of the optical depth to reionisation τ presented in Planck Collaboration Int. XLVI (2016), which we describe in Appendix B. For comparison, we also show the prediction of the recent Planck 2018 analysis Planck Collaboration VI (2018) which includes the final polarisation analysis (dot-dahed line). The shaded areas around model predictions correspond to uncertainties on the corresponding cosmological parameters, but do not include any error on scaling relations. Finally, the black thick line shows our best-fit Λ CDM model to the XXL clusters of Sect.3.2, which provides a very good fit to the data.
Current usage metrics show cumulative count of Article Views (full-text article views including HTML views, PDF and ePub downloads, according to the available data) and Abstracts Views on Vision4Press platform.
Data correspond to usage on the plateform after 2015. The current usage metrics is available 48-96 hours after online publication and is updated daily on week days.
Initial download of the metrics may take a while.