Fig. B.1.
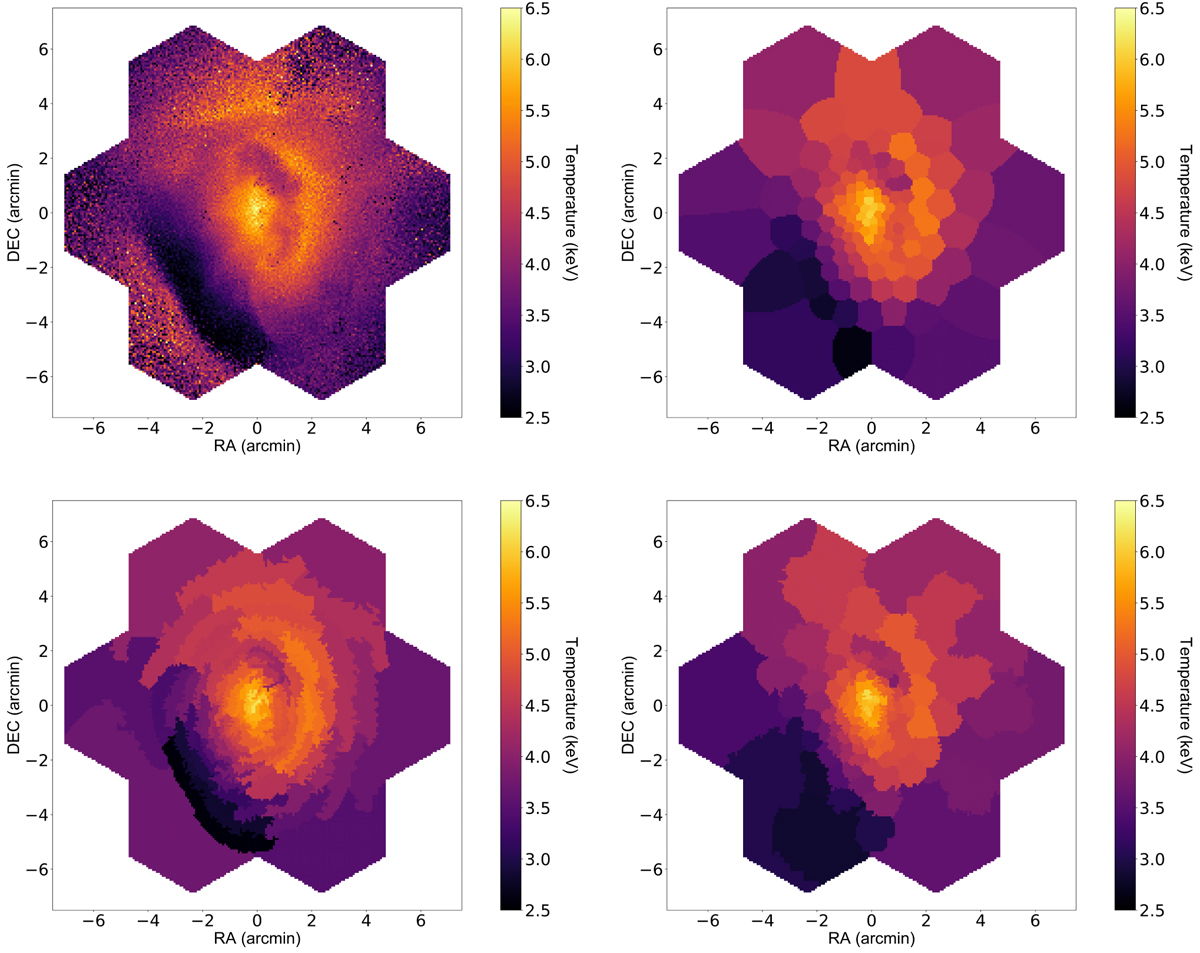
Spatial binning scheme comparison for cluster 4 spectroscopic temperature map (keV) without background, at redshift z = 0.105. Top left: unbinned raw input map from the hydrodynamical simulation. Top right: voronoi tessellation map using the algorithms described in (Cappellari & Copin 2003). Bottom left: contour map using contbin tool (Sanders 2006) with an aspect ratio constraint, Cfill = 2. Bottom right: same as bottom left, with Cfill = 1.
Current usage metrics show cumulative count of Article Views (full-text article views including HTML views, PDF and ePub downloads, according to the available data) and Abstracts Views on Vision4Press platform.
Data correspond to usage on the plateform after 2015. The current usage metrics is available 48-96 hours after online publication and is updated daily on week days.
Initial download of the metrics may take a while.