Fig. 5.
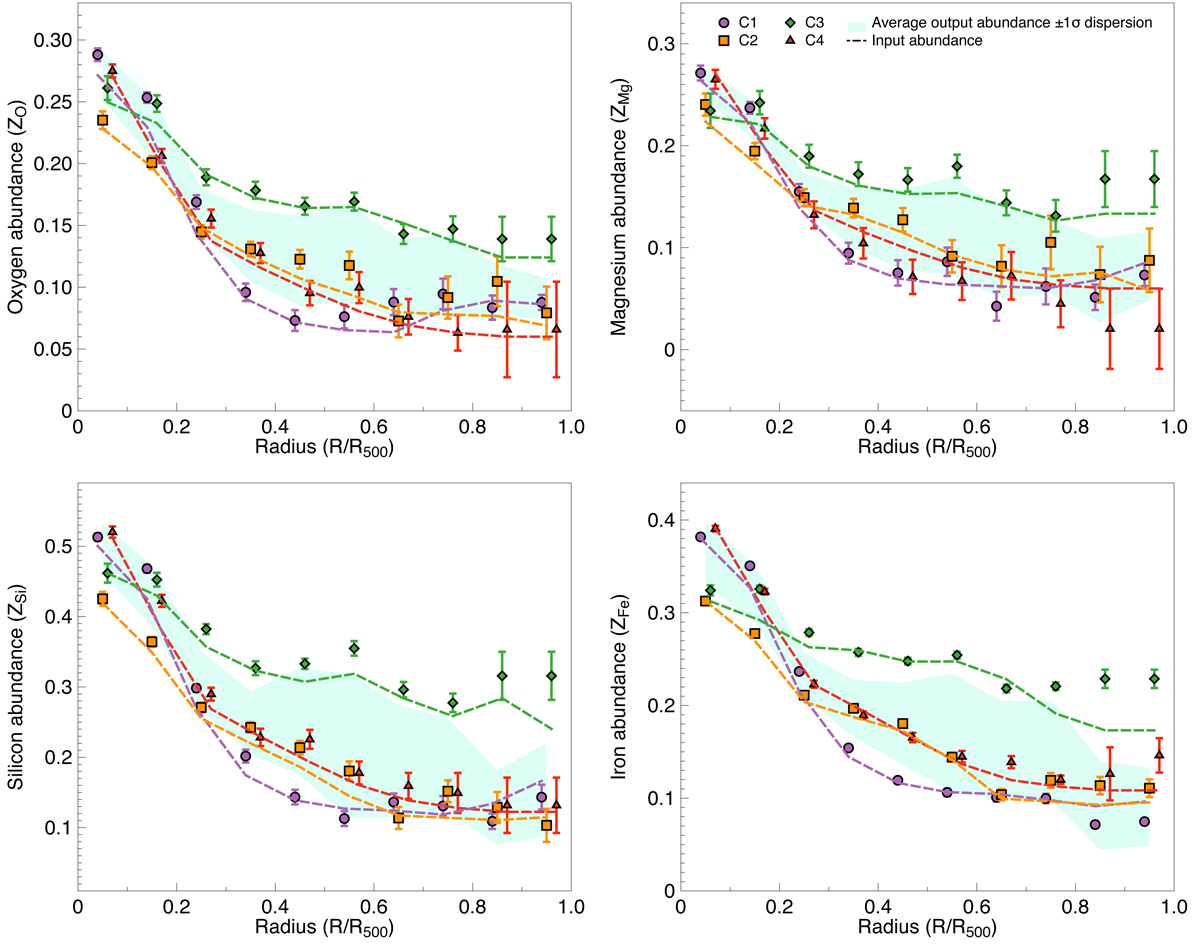
Best-fit values of the metallicity as a function of radius, up to R500 (0.1 R500 bins) for the entire sample (C1 – purple dots, C2 – orange squares, C3 – green diamonds, C4 – red triangles). From top left to bottom right: oxygen, magnesium, silicon and iron abundances with respect to solar. The dashed lines represent instead the profile of the emission-measure-weighted input abundances using the same colours. The cyan shaded envelope represents the ±1σ dispersion of the recovered output metallicity for the entire sample. Points are slightly shifted for clarity.
Current usage metrics show cumulative count of Article Views (full-text article views including HTML views, PDF and ePub downloads, according to the available data) and Abstracts Views on Vision4Press platform.
Data correspond to usage on the plateform after 2015. The current usage metrics is available 48-96 hours after online publication and is updated daily on week days.
Initial download of the metrics may take a while.