Fig. 3.
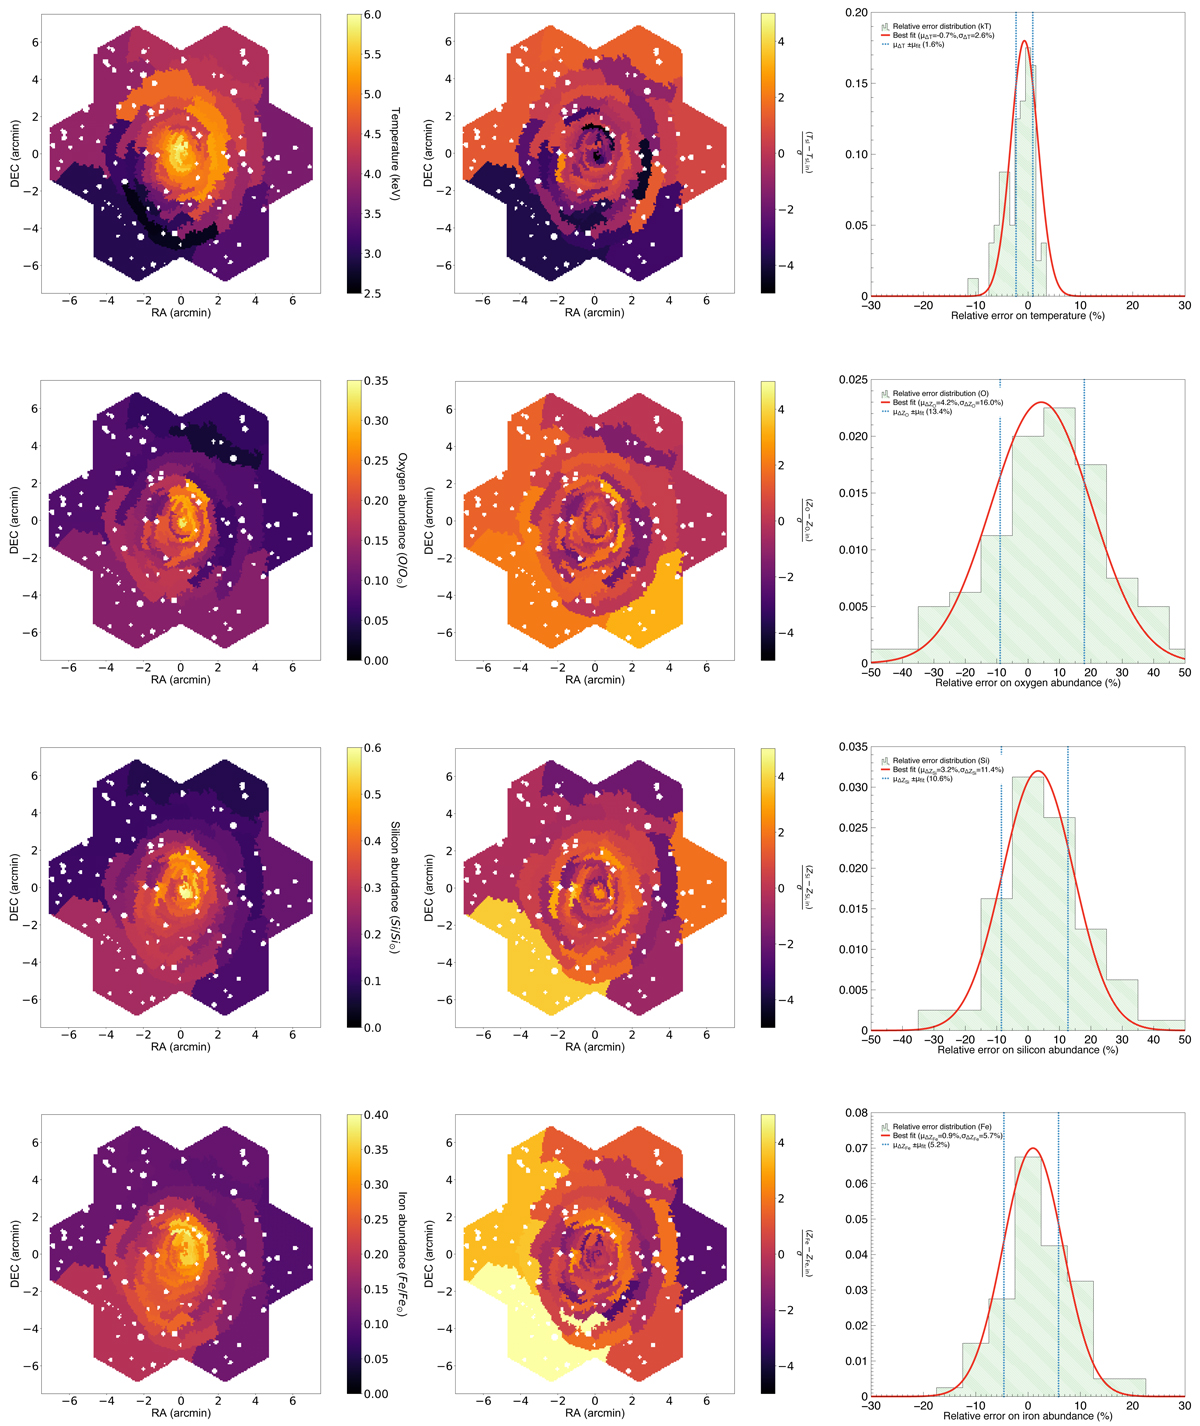
Left: reconstructed ICM parameters maps for C2 at z ∼ 0.1 using the multi-band fit presented in Sect. 4.6 with S/N ∼ 300 (∼90 000 counts per spatial bin). Middle: distribution within the regions j of (Pj − Pin, j)/σj indicating the goodness of the fit for each region in terms of σj (see Sect. 4.6). Right: relative error distribution across all spectral regions (green histogram). The red solid line pictures the Gaussian best fit. The vertical blue dashed lines are set at the mean value of the fit errors (see Sect. 4.6). From top to bottom: spectroscopic temperature Tsl (in keV), emission-measure-weighted abundances of oxygen (O), silicon (Si) and iron (Fe) (with respect to solar).
Current usage metrics show cumulative count of Article Views (full-text article views including HTML views, PDF and ePub downloads, according to the available data) and Abstracts Views on Vision4Press platform.
Data correspond to usage on the plateform after 2015. The current usage metrics is available 48-96 hours after online publication and is updated daily on week days.
Initial download of the metrics may take a while.