Fig. B.3.
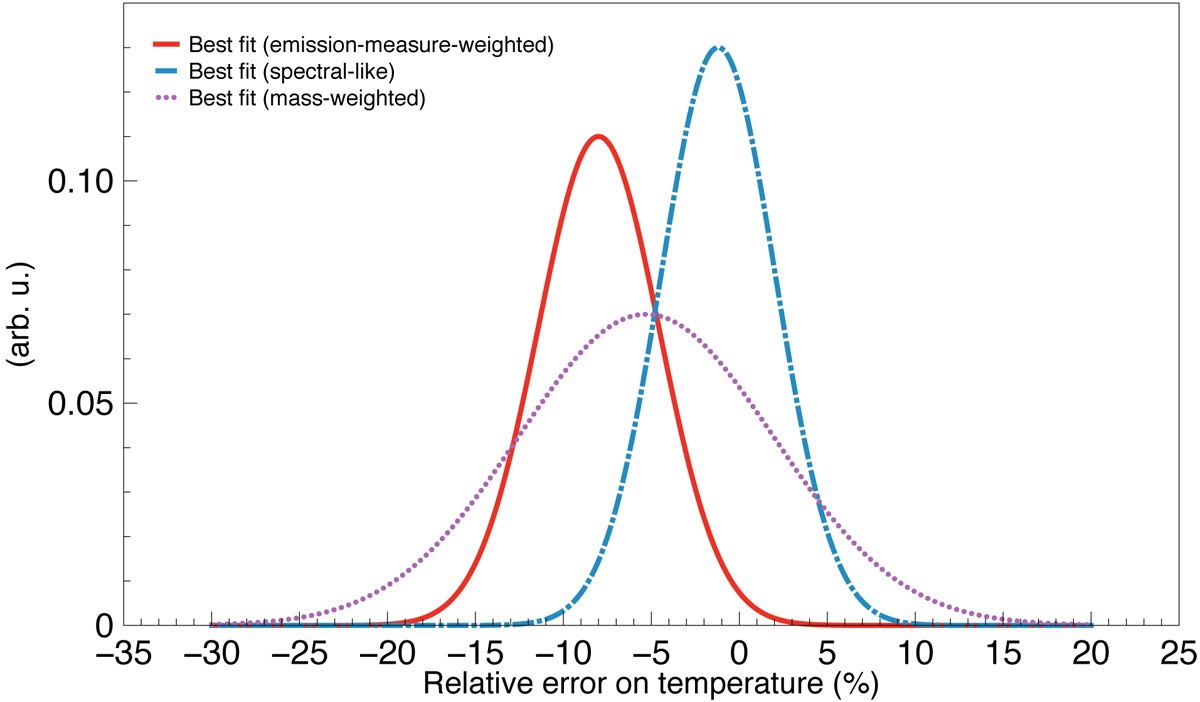
Gaussian best fits of the normalised relative error distribution on the measured temperature for different input map weighting scheme for cluster C4. The red solid curve indicates the emission-weighted best fit of the distribution (μΔT = −8.0%, σΔT = 3.4%). The blue dash-dotted line indicates the spectroscopic temperature best fit (μΔT = −1.2%, σΔT = 2.2%), while the dotted violet line indicates the best fit for a mass-weighted input (μΔT = −5.2%, σΔT = 7.2%).
Current usage metrics show cumulative count of Article Views (full-text article views including HTML views, PDF and ePub downloads, according to the available data) and Abstracts Views on Vision4Press platform.
Data correspond to usage on the plateform after 2015. The current usage metrics is available 48-96 hours after online publication and is updated daily on week days.
Initial download of the metrics may take a while.