| Issue |
A&A
Volume 620, December 2018
|
|
|---|---|---|
| Article Number | A114 | |
| Number of page(s) | 6 | |
| Section | Astrophysical processes | |
| DOI | https://doi.org/10.1051/0004-6361/201833857 | |
| Published online | 06 December 2018 | |
Mixed H/He bursts in SAX J1748.9–2021 during the spectral change of its 2015 outburst
1 Department of Physics, Xiangtan University, Xiangtan, 411105, PR China
e-mail: This email address is being protected from spambots. You need JavaScript enabled to view it.
2 International Space Science Institute (ISSI), Hallerstrasse 6, 3012 Bern, Switzerland
3 Albert Einstein Center for Fundamental Physics, Institute for Theoretical Physics/Laboratory for High-Energy Physics, University of Bern, Switzerland
4 Departement Physik, Universität Basel, Klingelbergstrasse 82, 4056 Basel, Switzerland
5 International Space Science Institute Beijing, No.1 Nanertiao, Zhongguancun, Haidian District, 100190 Beijing, PR China
6 Department of Astronomy, University of Geneva, Chemin d’ecogia 16, 1290 Versoix, Switzerland
7 SRON, Netherlands Institute for Space Research, Sorbonnelaan 2, 3584 CA Utrecht, The Netherlands
8 Tuorla Observatory, Department of Physics and Astronomy, 20014 University of Turku, Finland
9 Space Research Institute of the Russian Academy of Sciences, Profsoyuznaya str. 84/32, 117997 Moscow, Russia
10 Nordita, KTH Royal Institute of Technology and Stockholm University, Roslagstullsbacken 23, 10691 Stockholm, Sweden
11 Department of Physics and McGill Space Institute, McGill University, 3600 Rue University, Montreal, QC, H3A 2T8, Canada
12 School of Physics and Astronomy, Monash University, Australia, Australia VIC, 3800, Australia
13 Monash Centre for Astrophysics, Monash University, Australia, Australia VIC, 3800, Australia
14 Laboratory for Particle Astrophysics, Institute of High Energy Physics, Beijing, 100049, PR China
Received:
15
July
2018
Accepted:
12
October
2018
Abstract
SAX J1748.9–2021 is a transiently accreting X-ray millisecond pulsar. It is also known as an X-ray burster source discovered by Beppo-SAX. We analyzed the persistent emission and type-I X-ray burst properties during its 2015 outburst. The source changed from hard to soft state within half day. We modeled the broadband spectra of the persistent emission in the (1–250) keV energy band for both spectral states using the quasi-simultaneous INTEGRAL and Swift data. The broadband spectra are well fitted by an absorbed thermal Componization model, COMPPS, in a slab geometry. The best-fits for the two states indicate significantly different plasma temperature of 18 and 5 keV and the Thomson optical depths of three and four, respectively. In total, 56 type-I X-ray bursts were observed during the 2015 outburst, of which 26 detected by INTEGRAL in the hard state, 25 by XMM-Newton in the soft state, and five by Swift in both states. As the object transited from the hard to the soft state, the recurrence time for X-ray bursts decreased from ≈2 to ≈1 h. The relation between the recurrence time, Δtrec, and the local mass accretion rate per unit area onto the compact object, ṁ, is fitted by a power-law model, and yielded as best fit at Δtrec ∼ ⟨ṁ⟩−1.02±0.03 using all X-ray bursts. In both cases, the observed recurrence times are consistent with the mixed hydrogen and helium bursts. We also discuss the effects of type-I X-ray bursts prior to the hard to soft transition.
Key words: X-rays: binaries / X-rays: bursts / stars: neutron
© ESO 2018
1. Introduction
Neutron stars (NSs), in low mass X-ray binaries (LMXBs), accrete matter from their companion stars, forming an accretion disk (Frank et al. 2002). The accreted matter on the NS surface can trigger thermonuclear flashes, called type-I X-ray bursts (see e.g., Lewin et al. 1993). The burst spectra are described by a blackbody with peak temperatures reaching k T bb ≈ 3 keV, and with a gradual softening due to the cooling of the NS photosphere (see Lewin et al. 1993; Strohmayer & Bildsten 2006; Galloway et al. 2008, for a review). The burst peak luminosity can reach the Eddington limit, L Edd ≈ 2 × 1038 erg s−1, and the total burst energy release is on the order ∼1039 − 42 erg, depending on the burst type (e.g., Galloway et al. 2008).
During type-I X-ray bursts, the injected soft X-ray photons may affect the NS hot inner accretion flow or the surrounding hot corona. Indeed, a deficit has been observed at 30–50 keV photons in IGR J17473–2721, Aql X-1, 4U 1636–536, and GS 1826–238, implying that the soft X-ray photons, emitted during type-I X-ray bursts, cool down the electrons producing hard X-ray emission (Chen et al. 2012, 2013; Ji et al. 2013, 2014a, 2015). The hard persistent X-ray component is thought to be derived from Comptonization in the hot corona (Chen et al. 2012, 2013). A similar study has also been performed during the hard state of the source 4U 1728–34, however, during the occurrence of type-I X-ray bursts the persistent hard X-ray deficit was not detected by Rossi X-ray Timing Explorer, due to the limitation of the response in hard X-ray band (Ji et al. 2014b), but confirmed by INTEGRAL (Kajava et al. 2017). The persistent emission level above 40 keV was about a factor of three lower than the persistent emission without burst activities (Kajava et al. 2017). Also in this case the interpretation indicates that the soft radiation injection into the accretion disk or corona may induce spectral variability during type-I X-ray bursts.
It is believed that with varying mass accretion rate the spectral changes of NSs in LMXBs follow an atoll or Z−track on an X-ray color-color diagram (CCD; Hasinger & van der Klis 1989; van der Klis 2006). The accretion rate increases from the hard (island) spectral state, where the soft emission is much reduced and the spectrum is dominated by a power-law-like spectrum up to the energies of 200 keV, to the soft (banana-shaped) spectral state, where most of the energy is emitted below ∼20 keV (e.g., Barret 2001; Gierliński & Done 2002). The spectral change has been studied during type-I X-ray bursts (Falanga et al. 2006). We study SAX J1748.9–2021, as an example to investigate if the large number of type-I X-ray bursts during its 2015 February–June outburst can trigger a spectral state change – that is, from a persistent hard to a soft spectral state. In this paper, we report on the INTEGRAL and Swift observations of SAX J1748.9–2021. The properties of the largest set of X-ray bursts as well as the correlation of all observed type-I X-ray bursts with the source in the soft and hard state are investigated.
SAX J1748.9–2021. The X-ray source SAX J1748.9–2021 was discovered by Beppo-SAX during an outburst in 1998 (in’t Zand et al. 1998). The source has been identified to be located within the globular cluster NGC 6440 at a distance of ≈8.2 kpc (in’t Zand et al. 1999; Valenti et al. 2007, and references therein). The detection of a type-I X-ray burst associated to SAX J1748.9–2021 confirmed the source as a NS hosted in a LMXB system (in’t Zand et al. 2001). SAX J1748.9–2021 has also been observed during its quiescent state with Chandra, that identified its optical counterpart candidate (in’t Zand et al. 2001, and references therein). Altamirano et al. (2008) suggested that the companion star might be a main-sequence or a slightly evolved star with a mass ranging between (0.85 and 1.1) M ⊙. Recently, the companion star has been confirmed by the H u b b l e Space Telescope, and it turns out to be a main-sequence star with a mass of (0.70–0.83) M ⊙, a radius of (0.88 ± 0.02) R ⊙, and a surface temperature of (5250 ± 80) K (Cadelano et al. 2017). This source has been observed in outburst in 1998, 2001, 2005, 2009–2010, and 2015 and classified also as an atoll source (in’t Zand et al. 1998, 2001; Markwardt & Swank 2005; Suzuki et al. 2009; Patruno et al. 2009; Bozzo et al. 2015; Sanna et al. 2016; Pintore et al. 2016). During both 2001 and 2005 outbursts the source showed intermittent pulsations at 442 Hz on timescales of hundreds of seconds (Gavriil et al. 2007; Altamirano et al. 2008), from which it was possible to infer the orbital period of ≈8.76 h and the magnetic field of B ≳ 1.3 × 10⁸ G (Altamirano et al. 2008). Therefore, this source has been classified as an accreting millisecond X-ray pulsar (AMXP; see Poutanen 2006; Patruno & Watts 2012, for reviews).
2. Observations and data
2.1. INTEGRAL
The data were obtained with INTEGRAL (Winkler et al. 2003) from 2015 February 16 to April 20, that is, from satellite revolution 1508 to 1532 for a total effective exposure time of ∼856 ks. These revolutions include a public target of opportunity (ToO) observation for ∼100 ks during the revolution 1511.
We analyzed data from the coded mask imager IBIS/ISGRI (Ubertini et al. 2003; Lebrun et al. 2003), covering the 20–250 keV energy band, and from the two JEM-X monitors covering the 4–22 keV energy range (Lund et al. 2003). The observation in revolution 1511 was performed in the hexagonal dithering mode, which permits to keep always the source within both the field-of-view of IBIS/ISGRI and JEM-X. For all other revolutions, we considered all the pointings for which the source was located at a maximum off-set angle with respect to the satellite aim point of  for IBIS/ISGRI and
  for JEM-X in order to minimize calibration uncertainties. The data reduction was performed using the standard OFFLINE SCIENCE ANALYSIS (OSA) version 10.2 distributed by the ISDC (Courvoisier et al. 2003). The algorithms used for the spatial and spectral analysis of ISGRI and JEM-X are described in Goldwurm et al. (2003) and Lund et al. (2003), respectively.
In Fig. 1, we show part of the ISGRI field of view (significance map) centered on the position of SAX J1748.9–2021. The source is clearly detected in the mosaic, and we estimated a detection significance of ∼126σ in the 20–100 keV energy range. The best-determined ISGRI position is  and
and  with an associated uncertainty of
  at 90% confidence level (Gros et al. 2003), consistent with the most accurate CXO X-ray position (Pooley et al. 2002).
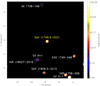 |
Fig. 1. IBIS/ISGRI sky image centered on SAX J1748.9–2021 in the 20–100 keV range of the ∼100 ks ToO observation. The size of each pixel is 3′. |
Using the ISGRI data in the energy band 15–300 keV, starting from revolution 1508, we performed a timing analysis to search for the pulsations. We applied the same timing techniques as used for the ISGRI data in the past (see e.g., Kuiper et al. 2003; Falanga et al. 2005a, 2007, 2011, 2012; De Falco et al. 2017b,a), adopting the ephemeris reported in Sanna et al. (2016). No pulsed emission has been detected above 15 keV, which is in line with the very low pulsed fraction of ∼2% as detected by XMM-Newton above 10 keV (Sanna et al. 2016).
We extracted the IBIS/ISGRI and JEM-X light curve of SAX J1748.9–2021 at a time scale of typically ∼2 − 3 ks, in other words, the duration of a pointing (science window). To search for type-I X-ray bursts, we used the JEM-X data also at a time resolution of two seconds, as discussed in Sect. 5. The JEM-X and ISGRI spectra were extracted for the hard and soft state quasi-contemporaneous with Swift observations (see Sect. 4).
2.2. Swift
Swift/XRT (Burrows et al. 2005) detected SAX J1748.9–2021 in outburst after a 2 ks observation on 2015 February 18 (Bozzo et al. 2015). The XRT monitoring campaign covered the 2015 outburst from February 25 to July 30 comprising a total of 40 pointings and the effective exposure time of ∼43 ks.
We processed the Swift/XRT data by using standard procedures (Burrows et al. 2005) and the calibration files version 20160113. The Swift/XRT data were taken both in window-timing (WT) and photon-counting (PC) modes (processed with the XRTPIPELINE v.0.13.2). Filtering and screening criteria were applied by using FTOOLS contained in the HEASOFT software package (v6.19)1. We extracted source and background light curves and spectra by selecting event grades of 0–2 and 0–12 for the WT and PC mode, respectively. We used the latest spectral redistribution matrices in the HEASARC calibration database. Ancillary response files, accounting for different extraction regions, vignetting and PSF corrections, were generated by using the XRTMARKF task. We corrected PC data for pile-up when required, and used the XRTLCCORR task to account for this correction in the background-subtracted light curve.
2.3. XMM-Newton
SAX J1748.9–2021 was observed with XMM-Newton (Jansen et al. 2001) on March 4, 2015 (Obs.ID. 0748391301) continuously for about ∼100 ks with the first results reported in Pintore et al. (2016). We reanalyzed the XMM-Newton observation to obtain each burst flux and its fluence. Following the standard procedure, the TIMING data from European Photon Imaging Camera (EPIC)-pn (Strüder et al. 2001) were reduced and the last 5 ks of the data were ignored because of flaring background. The data were filtered with FLAG=0 and PATTERN≤4. For each burst we extracted of the lightcurve then located its start and end time at which the count rate increased and decreased to 10% of its peak value above the persistent intensity level, respectively. The spectrum of each burst was obtained in the range RAWX=[31:43] without the column RAWX=37 to reduce the pile-up effect. The persistent spectrum prior to a burst was regarded as its background. Each burst spectrum was fitted by the model TBABS*BBODYRAD, and the burst bolometric flux was calculated using the relation F = 1.076 × 10⁻¹¹(kTbb/1 keV)4Kbb ergs cm−2 s−1 (Galloway et al. 2008), where kTbb and Kbb are the blackbody temperature and normalization, respectively. The XMM-Newton data reduction and analysis was similar to the procedure described in Pintore et al. (2016). All reported fluxes are unabsorbed.
3. Outburst light curve
We report in Fig. 2 the outburst profile of SAX J1748.9–2021 from February 16 to May 2, 2015. SAX J1748.9–2021 exhibited significant spectral variation during the outburst, passing from hard to soft state within ≈0.5 d around MJD 57079.5. The hard state lasted for the first ≈10 d, while the soft state lasted about 50 d, until the source returned to quiescence. Most AMXPs that underwent an outburst for a few weeks to months showed a common outburst profile, meaning that the light curve decays exponentially until it reaches a break, after which the flux drops linearly to the quiescence level without exhibiting strong spectral variation (e.g., Gierliński et al. 2002; Gierliński & Poutanen 2005; Falanga et al. 2005a,b, 2011, 2012, 2007; Ibragimov & Poutanen 2009; De Falco et al. 2017b,a). However, this source is known to be an atoll source with significant flux variations between hard and soft state and showing intermittent pulsations whose origin is unclear (see e.g., Patruno et al. 2009).
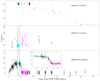 |
Fig. 2. SAX J1748.9–2021 light curve during the 2015 outburst. The vertical dashed lines, indicate the ∼100 ks INTEGRAL ToO time interval. The black, green, and red vertical lines indicate the times of the detected type-I X-ray bursts with INTEGRAL, Swift and XMM-Newton, respectively. In the bottom panel the inset shows the hard ISGRI light curve zoomed in at the spectral change time interval. The count rate drops to zero within 0.5 day. The hard and soft state data points used in the spectral analysis are color coded with light blue and pink, respectively (see Sect. 4). |
4. Spectral analysis
The spectral analysis was carried out using XSPEC version 12.6 (Arnaud 1996). We studied the broadband X-ray spectrum divided in the hard and soft state, see Fig. 2. For the hard state we consider the INTEGRAL/JEM-X (3.5–22) keV and ISGRI (20–250) keV ToO data between MJD 57076.52–57077.82, and the quasi-simultaneous Swift/XRT/WT (1–10) keV data starting on MJD 57078.43 for 1 ks (obs. ID 00033646003). For the soft state we consider the INTEGRAL/JEM-X (4–22) keV and ISGRI (20–50) keV public data between MJD 57079.83–57084.03 and one simultaneous Swift/XRT/WT (1–10) keV data for a total of 2 ks (obs ID. 00033646004). We did not merge together the additional two close-by Swift pointings ID. 00033646006 and ID. 00033646005, as the roll angle between the three pointings was different and the statistical quality of the first pointing we used was sufficient to perform an accurate broadband fit. We verified a posteriori that performing the same broadband fit with the other two Swift pointings would have resulted in similar values of the model parameters (to within the uncertainties). For all spectra the bursts intervals have been removed from the data set. For each instrument, a multiplication factor was included in the fit to take into account the uncertainty in the cross-calibration of the instruments. For all fits the factor was fixed at 1 for the INTEGRAL/ISGRI data. All uncertainties in the spectral parameters are given at a 1σ confidence level for a single parameter.
We fit all the combined XRT/JEM-X/ISGRI average spectra separately for the hard and soft spectral state, respectively, using first a simple and phenomenological cutoff power-law model and then a physical motivated thermal Componization model, COMPPS, in the slab geometry (Poutanen & Svensson 1996). The latter model has been used previously to fit AMXPs broadband spectra (e.g., Gierliński et al. 2002; Gierliński & Poutanen 2005; Falanga et al. 2005b,a, 2007, 2011, 2012; Ibragimov & Poutanen 2009; De Falco et al. 2017b,a). The main parameters are the absorption column density, NH, the Thomson optical depth, τT, across the slab, the electron temperature, kTe, the temperature, kTseed, of the soft-seed thermal photons (assumed to be injected from the bottom of the slab), the apparent area of the seed photons, Aseed, and cosθ that we fixed at 0.5, where θ is the inclination angle between the slab normal and the observer line of sight. The best-fit parameters of all models are reported in Table 1. Unlike Pintore et al. (2016) we find no evidence of the DISKBB component from the residuals of our best fit comptonization models (see also Fig. 3).
Best fit parameters determined for the hard and soft spectral state of SAX J1748.9–2021.
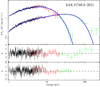 |
Fig. 3. Unfolded broadband spectrum of SAX J1748.9–2021 showing the hard and soft spectral states. The data points are from the Swift/XRT (black crosses), INTEGRAL/JEM-X (red crosses), and INTEGRAL/ISGRI (green crosses). The best fit is obtained with the COMPPS model, represented by a solid blue line. The lower panels show the residuals between the data and the model. The Swift/XRT spectra have been rebinned for a better visualization. |
We note that the column density between the two states changes from NH ∼ 0.5 × 1022 cm−2 to NH ∼ 0.8 × 1022 cm−2, as well as the plasma temperature, kTe, and the optical depth, τT (see Table 1). It is remarkable how this spectral change from a hard to soft state occurred within just a half day (see Fig. 2).
5. Type-I X-ray bursts
SAX J1748.9–2021 is also known to be a burster source, as during its 2015 outburst 56 type-I X-ray bursts have been detected (see Fig. 2), of which 26 found by INTEGRAL/JEM-X, five by Swift, and for completeness we added also 25 bursts observed by XMM-Newton and reported by (Pintore et al. 2016). These bursts occurred during both the hard and soft states. However, we analyzed in more detail the bursts detected during the continuous INTEGRAL ToO and XMM-Newton observations, where the bursts were separated by two distinct time intervals of around Δtrec, hard ∼ 2 h (hard state, INTEGRAL data) and Δtrec, soft ∼ 1 h (soft state, XMM-Newton data). All bursts lasted on average ≈100 s and showed a rise time of ∼2 − 3 s. The burst decay profile could be well fitted with an exponential function and the correspondingly derived e-folding time is τfit = 23 ± 3 s, that is in agreement with the value reported by Pintore et al. (2016), estimated to be 25 ± 1 s (typo in their article, private communication). We note that all the bursts outside these two observations also showed comparable τfit values and similar burst profiles.
The averaged flux in the 0.1–50 keV and 0.1–250 keV energy range of the persistent emission during the soft and hard states, respectively, was Fpers, soft ≈ (5.48 − 6.13)×10−9 erg cm−2 s−1 for XMM-Newton bursts and Fpers, hard ≈ (2.88 − 3.35)×10−9 erg cm−2 s−1 when INTEGRAL/JEM-X detected the bursts. The corresponding luminosities are Lpers, soft ≈ (4.4 − 4.9)×1037 erg s−1, i.e., (12 − 13)% LEdd, and Lpers, hard ≈ (2.32 − 2.70)×1037 erg s−1, i.e., (6 − 7)% LEdd, where LEdd = 3.8 × 1038 erg cm−2 s−1 is the Eddington luminosity adopted by Kuulkers & den Hartog (2003). We have used d = 8.2 kpc as the distance to the source.
The local accretion rate per unit area onto the compact object is ṁ = Lpers(1 + z)(4πR2(GM/R))−1, i.e., ṁsoft ≈ 2.67 × 10⁴ g cm−2 s−2 and ṁhard ≈ (1.30−1.51) × 104 g cm−2 s−1, where the gravitational redshift is 1 + z = 1.31 for a canonical NS with a mass M = 1.4 M⊙ and a radius of R = 10 km. The observed recurrence time increases with ṁ as Δtrec ∼⟨ṁ⟩−1.02±0.03 (see Fig. 4).
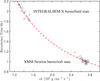 |
Fig. 4. Recurrence time versus local mass accretion rate per unit area onto the compact object, where the circles and triangles represent the type-I X-ray bursts detected by XMM-Newton and INTEGRAL/JEM-X, respectively. The dashed red lines represent the best-fit power-law model for all bursts Δtrec ∼ ⟨ṁ⟩−1.02±0.03. The recurrence time decreased from ∼2 h to ∼1 h as the persistent spectrum showed the transition from the hard to the soft state. |
For the bursts in the soft state, the total burst fluence is fb,soft ≈ 0.35 × 10⁻⁶ erg cm−2, obtained from the burst flux multiplied by the corresponding burst duration. For the bursts in the hard state, the peak flux is Fpeak, hard ≈ 1.6 × 10⁻⁸ erg cm−2 s−1, that multiplied by τfit ≈ 23 s give an estimation of the total burst fluence of fb,hard ≈ 0.37 × 10⁻⁶ erg cm−2. We note that these values are close to the directly measured total fluence per burst.
We were then able to estimate the ignition depth at the onset of the burst with the equation yign = 4πfb d2 (1 + z) (4πR2Qnuc)−1, where the nuclear energy generated for solar composition (assuming X̄ = 0.7) is Qnuc ≈ 1.31 + 6.95X̄ − 1.92X̄2 MeV nucleon−1 ≈ 4.98 MeV nucleon−1 (Goodwin et al. 2018). We note that the considered values Qnuc include losses owing to neutrino emission as determined by using Kepler (Woosley et al. 2004). Therefore we obtained yign,soft ≈ 0.59 × 10⁸ g cm−2 and yign, hard ≈ 0.63 × 10⁸ g cm−2 for the soft and hard state, respectively.
Once the ignition depth is known, the recurrence time between the bursts can be calculated by using the equation Δtrec = (yign/ṁ)(1 + z). For the soft state, we obtain Δtrec, soft ∼ 0.81 h, and for the hard state we obtain Δtrec, hard ∼ 1.6 h in the mixed hydrogen and helium burning case. For the pure helium burning, the predicted recurrence time is much longer. Compared with the observed recurrence time and ṁ, these results confirm that the burst type is mixed hydrogen and helium with solar abundances for both the hard and soft state (see Fig. 4). In addition this can be additionally validated by the α value (see e.g., Strohmayer & Bildsten 2006). We computed the ratio of the integrated persistent flux to the burst fluence, α = τrecFper/fb, which are 64 ± 10 for the soft bursts and 60 ± 6 for the hard bursts. The α-values are consistent with the mixed hydrogen and helium bursts from SAX J1748.9–2021 reported by Galloway et al. (2008).
If we consider the anisotropy of the persistent and burst emission, that is, with a factor of ξp and ξb respectively, we expect several consequences (see He & Keek 2016, and references therein). The local accretion rate (ṁ) should be multiplied by the factor ξp, however, it will not affect the obtained power-law index of the Δtrec − ⟨ṁ⟩ relation if the accretion disk shape did not change dramatically from the soft to hard transition (in both cases, ṁ is multiplied by the same factor). The predicted recurrence time is proportional to the observed value, fb/Fpers, so it should be changed with a factor of ξb/ξp. The intrinsic α parameter can be obtained from the observed value divided by a factor of ξb/ξp (Fujimoto 1988). The ξb/ξp factor is estimated in the range 1–1.5 for the low inclination system of SAX J1748.9–2021 (He & Keek 2016). These modifications still support the mixed hydrogen and helium bursts occurred in SAX J1748.9–2021.
6. Discussions and conclusions
SAX J1748.9–2021 has shown 17 bursts during the 1998 outburst detected by Beppo-SAX, 16 bursts during the 2001 outburst, two bursts during the 2005 outburst, and 13 bursts during the 2009–2010 outburst, all detected by RXTE (Galloway et al. 2008). The total number of X-ray bursts was enlarged by the 56 bursts detected during the 2015 outburst. The bursts in soft and hard states are similar in terms of their e-folding time, the peak flux, and the total fluence. Compared with the calculated recurrence time, we conclude that all bursts are generated from mixed hydrogen/helium burning on the NS surface. However, this source appeared to alternate between helium or mixed hydrogen and helium bursts independently of the persistent flux (Galloway et al. 2008), while during the 2015 outburst, studied in detail in this work, the mixed hydrogen and helium bursts follow the theoretical predicted recurrence time as function of the mass accretion rate Δtrec ∼ ⟨ṁ⟩−1.02±0.03 (see Fig. 4).
We have studied the spectral behavior of SAX J1748.9–2021 during its 2015 outburst by using the available INTEGRAL, Swift, and XMM-Newton data. The source shows a spectral change from hard to soft state within ∼0.5 day around MJD 57079.5 (see Fig. 2). Usually, the hard to soft transitions occurred in the rise phase of the outbursts in LMXBs (see Remillard & McClintock 2006, for reviews). The hard-to-soft transitions in LMXBs were explained in different ways: the increasing of mass accretion rate (Esin et al. 1997), the shrinking of the corona size (Homan et al. 2001), the competition between inner halo and outer standard thin accretion disk (Smith et al. 2002), and non-stationary accretion (Yu & Yan 2009). The duration of the outbursts’ rise phase in LMXBs can be regarded as the timescale of the hard to soft transition, which has a mean value of 5 days and a minimum value of approximately one day (Yan & Yu 2015). Compared with the large sample of outbursts in 36 LMXBs (Yan & Yu 2015), the rapid spectral transition in SAX J1748.9–2021 during the 2015 outburst had the shortest duration. We suggest that the production of soft X-ray photons from type-I X-ray bursts may have accelerated the hard-to-soft spectral transition.
Before the transition, the persistent emission in the 20–100 keV range maintained at a high level in approximately five days (see the bottom panel in Fig. 2). Considering the recurrence time of ∼2 h in the hard state, we expect that a total number of type-I bursts of ∼60 should have occurred in SAX J1748.9-2021, and so ∼35 of these are probably missed because the source was outside the field of view of JEM-X. With the averaged energy release, 3 × 1039 ergs, of type-I X-ray bursts, the total energy of 1.8 × 1041 ergs was emitted in the hard state. The X-ray bursts in SAX J1748.9–2021 may play two roles in the hard-to-soft transition by ejecting a bunch of soft X-ray photons and dragging the accretion flow inward to enhance the persistent X-ray emission (Walker 1992). In both cases, the produced soft photons pass through the corona and cool down the electrons there, which can reduce the corona size and shorten the duration of the hard-to-soft transition. Moreover, we find the source EXO 1745-248 showing a similar behavior, especially considering the two outbursts at MJD 51776 and MJD 52459, respectively. The first outburst was more energetic than the second one. However, the hard-to-soft transition duration in the first outburst, at approximately four days, was smaller than the second, approximately five days (Yan & Yu 2015). Meanwhile, dozens of X-ray bursts happened before the hard to state transition in the first outburst (Galloway et al. 2008). Considering that more total energy released in the first outburst, we suggested that X-ray bursts may also accelerate the hard-to-soft spectral transition during the first outburst in EXO 1748-248.
Acknowledgments
We appreciate the suggestions of the referee, which improved the paper. Z.L. thanks S.S. Weng for helpful discussions. Z.L. was supported by the Swiss Government Excellence Scholarships for Foreign Scholars. Z.L. thanks the International Space Science Institute and University of Bern for the hospitality. This work was supported by National Natural Science Foundation of China (Grant No. 11703021) and Hunan Provincial Natural Science Foundation of China (Grant Nos. 2017JJ3310 and 2018JJ3495). V.D.F. and M.F. acknowledge the Swiss National Science Foundation project 200021_149865, who financed this research project. V.D.F. acknowledges the International Space Science Institute in Bern for their support. J.P. was supported by the grant 14.W03.31.0021 of the Ministry of Education and Science of the Russian Federation.
References
- Altamirano, D., Casella, P., Patruno, A., Wijnands, R., & van der Klis, M. 2008, ApJ, 674, L45 [NASA ADS] [CrossRef] [Google Scholar]
- Arnaud, K. A. 1996, in Astronomical Data Analysis Software and Systems V, eds. G. H. Jacoby, & J. Barnes, ASP Conf. Ser., 101, 17 [NASA ADS] [Google Scholar]
- Barret, D. 2001, Adv. Space Res., 28, 307 [NASA ADS] [CrossRef] [Google Scholar]
- Bozzo, E., Kuulkers, E., & Ferrigno, C. 2015, ATel, 7106 [Google Scholar]
- Burrows, D. N., Hill, J. E., Nousek, J. A., et al. 2005, Space Sci. Rev., 120, 165 [NASA ADS] [CrossRef] [Google Scholar]
- Cadelano, M., Pallanca, C., Ferraro, F. R., et al. 2017, ApJ, 844, 53 [NASA ADS] [CrossRef] [Google Scholar]
- Chen, Y.-P., Zhang, S., Zhang, S.-N., Li, J., & Wang, J.-M. 2012, ApJ, 752, L34 [NASA ADS] [CrossRef] [Google Scholar]
- Chen, Y.-P., Zhang, S., Zhang, S.-N., et al. 2013, ApJ, 777, L9 [NASA ADS] [CrossRef] [Google Scholar]
- Courvoisier, T. J.-L., Walter, R., Beckmann, V., et al. 2003, A&A, 411, L53 [NASA ADS] [CrossRef] [EDP Sciences] [Google Scholar]
- De Falco, V., Kuiper, L., Bozzo, E., et al. 2017a, A&A, 599, A88 [NASA ADS] [CrossRef] [EDP Sciences] [Google Scholar]
- De Falco, V., Kuiper, L., Bozzo, E., et al. 2017b, A&A, 603, A16 [NASA ADS] [CrossRef] [EDP Sciences] [Google Scholar]
- Esin, A. A., McClintock, J. E., & Narayan, R. 1997, ApJ, 489, 865 [NASA ADS] [CrossRef] [Google Scholar]
- Falanga, M., Bonnet-Bidaud, J. M., Poutanen, J., et al. 2005a, A&A, 436, 647 [NASA ADS] [CrossRef] [EDP Sciences] [Google Scholar]
- Falanga, M., Kuiper, L., Poutanen, J., et al. 2005b, A&A, 444, 15 [NASA ADS] [CrossRef] [EDP Sciences] [Google Scholar]
- Falanga, M., Götz, D., Goldoni, P., et al. 2006, A&A, 458, 21 [NASA ADS] [CrossRef] [EDP Sciences] [Google Scholar]
- Falanga, M., Poutanen, J., Bonning, E. W., et al. 2007, A&A, 464, 1069 [NASA ADS] [CrossRef] [EDP Sciences] [Google Scholar]
- Falanga, M., Kuiper, L., Poutanen, J., et al. 2011, A&A, 529, A68 [NASA ADS] [CrossRef] [EDP Sciences] [Google Scholar]
- Falanga, M., Kuiper, L., Poutanen, J., et al. 2012, A&A, 545, A26 [NASA ADS] [CrossRef] [EDP Sciences] [Google Scholar]
- Frank, J., King, A., & Raine, D. J. 2002, Accretion Power in Astrophysics, 3rd edn. (Cambridge, UK: Cambridge University Press), 398 [Google Scholar]
- Fujimoto, M. Y. 1988, ApJ, 324, 995 [NASA ADS] [CrossRef] [Google Scholar]
- Galloway, D. K., Muno, M. P., Hartman, J. M., Psaltis, D., & Chakrabarty, D. 2008, ApJS, 179, 360 [NASA ADS] [CrossRef] [Google Scholar]
- Gavriil, F. P., Strohmayer, T. E., Swank, J. H., & Markwardt, C. B. 2007, ApJ, 669, L29 [NASA ADS] [CrossRef] [Google Scholar]
- Gierliński, M., & Done, C. 2002, MNRAS, 331, L47 [NASA ADS] [CrossRef] [Google Scholar]
- Gierliński, M., & Poutanen, J. 2005, MNRAS, 359, 1261 [NASA ADS] [CrossRef] [Google Scholar]
- Gierliński, M., Done, C., & Barret, D. 2002, MNRAS, 331, 141 [NASA ADS] [CrossRef] [Google Scholar]
- Goldwurm, A., David, P., Foschini, L., et al. 2003, A&A, 411, L223 [NASA ADS] [CrossRef] [EDP Sciences] [Google Scholar]
- Goodwin, A. J., Galloway, D. K., & Heger, A. 2018, ArXiv e-prints [arXiv:1808.02225] [Google Scholar]
- Gros, A., Goldwurm, A., Cadolle-Bel, M., et al. 2003, A&A, 411, L179 [NASA ADS] [CrossRef] [EDP Sciences] [Google Scholar]
- Hasinger, G., & van der Klis, M. 1989, A&A, 225, 79 [NASA ADS] [Google Scholar]
- He, C.-C., & Keek, L. 2016, ApJ, 819, 47 [NASA ADS] [CrossRef] [Google Scholar]
- Homan, J., Wijnands, R., van der Klis, M., et al. 2001, ApJS, 132, 377 [NASA ADS] [CrossRef] [Google Scholar]
- Ibragimov, A., & Poutanen, J. 2009, MNRAS, 400, 492 [NASA ADS] [CrossRef] [Google Scholar]
- in’t Zand, J., Heise, J., Bazzano, A., et al. 1998, IAU Circ., 6997 [Google Scholar]
- in’t Zand, J. J. M., Verbunt, F., Strohmayer, T. E., et al. 1999, A&A, 345, 100 [NASA ADS] [Google Scholar]
- in’t Zand, J. J. M., van Kerkwijk, M. H., Pooley, D., et al. 2001, ApJ, 563, L41 [NASA ADS] [CrossRef] [Google Scholar]
- Jansen, F., Lumb, D., Altieri, B., et al. 2001, A&A, 365, L1 [NASA ADS] [CrossRef] [EDP Sciences] [Google Scholar]
- Ji, L., Zhang, S., Chen, Y., et al. 2013, MNRAS, 432, 2773 [NASA ADS] [CrossRef] [Google Scholar]
- Ji, L., Zhang, S., Chen, Y., et al. 2014a, ApJ, 782, 40 [NASA ADS] [CrossRef] [Google Scholar]
- Ji, L., Zhang, S., Chen, Y.-P., et al. 2014b, A&A, 564, A20 [NASA ADS] [CrossRef] [EDP Sciences] [Google Scholar]
- Ji, L., Zhang, S., Chen, Y., et al. 2015, ApJ, 806, 89 [NASA ADS] [CrossRef] [Google Scholar]
- Kajava, J. J. E., Sánchez-Fernández, C., Kuulkers, E., & Poutanen, J. 2017, A&A, 599, A89 [NASA ADS] [CrossRef] [EDP Sciences] [Google Scholar]
- Kuiper, L., Hermsen, W., Walter, R., & Foschini, L. 2003, A&A, 411, L31 [NASA ADS] [CrossRef] [EDP Sciences] [Google Scholar]
- Kuulkers, E., den Hartog, P. R., in’t Zand, J. J. M., et al. 2003, A&A, 399, 663 [NASA ADS] [CrossRef] [EDP Sciences] [Google Scholar]
- Lebrun, F., Leray, J. P., Lavocat, P., et al. 2003, A&A, 411, L141 [NASA ADS] [CrossRef] [EDP Sciences] [Google Scholar]
- Lewin, W. H. G., van Paradijs, J., & Taam, R. E. 1993, Space Sci. Rev., 62, 223 [NASA ADS] [CrossRef] [Google Scholar]
- Lund, N., Budtz-Jørgensen, C., Westergaard, N. J., et al. 2003, A&A, 411, L231 [NASA ADS] [CrossRef] [EDP Sciences] [Google Scholar]
- Markwardt, C. B., & Swank, J. H. 2005, ATel, 495 [Google Scholar]
- Patruno, A., & Watts, A. L. 2012, ArXiv e-prints [arXiv:1206.2727] [Google Scholar]
- Patruno, A., Altamirano, D., Hessels, J. W. T., et al. 2009, ApJ, 690, 1856 [NASA ADS] [CrossRef] [Google Scholar]
- Pintore, F., Sanna, A., Di Salvo, T., et al. 2016, MNRAS, 457, 2988 [NASA ADS] [CrossRef] [Google Scholar]
- Pooley, D., Lewin, W. H. G., Verbunt, F., et al. 2002, ApJ, 573, 184 [NASA ADS] [CrossRef] [Google Scholar]
- Poutanen, J. 2006, Adv. Space Res., 38, 2697 [NASA ADS] [CrossRef] [Google Scholar]
- Poutanen, J., & Svensson, R. 1996, ApJ, 470, 249 [NASA ADS] [CrossRef] [Google Scholar]
- Remillard, R. A., & McClintock, J. E. 2006, ARA&A, 44, 49 [NASA ADS] [CrossRef] [Google Scholar]
- Sanna, A., Burderi, L., Riggio, A., et al. 2016, MNRAS, 459, 1340 [Google Scholar]
- Smith, D. M., Heindl, W. A., & Swank, J. H. 2002, ApJ, 569, 362 [NASA ADS] [CrossRef] [Google Scholar]
- Strohmayer, T., & Bildsten, L. 2006, in New Views of Thermonuclear Bursts, eds. W. H. G. Lewin, & M. van der Klis, 113 [Google Scholar]
- Strüder, L., Briel, U., Dennerl, K., et al. 2001, A&A, 365, L18 [NASA ADS] [CrossRef] [EDP Sciences] [Google Scholar]
- Suzuki, M., Negoro, H., Nakahira, S., et al. 2009, ATel, 2360 [Google Scholar]
- Ubertini, P., Lebrun, F., Di Cocco, G., et al. 2003, A&A, 411, L131 [NASA ADS] [CrossRef] [EDP Sciences] [Google Scholar]
- Valenti, E., Ferraro, F. R., & Origlia, L. 2007, AJ, 133, 1287 [NASA ADS] [CrossRef] [Google Scholar]
- van der Klis, M. 2006, in Rapid X-ray Variability, eds. W. H. G. Lewin, & M. van der Klis, 39 [Google Scholar]
- Walker, M. A. 1992, ApJ, 385, 642 [NASA ADS] [CrossRef] [Google Scholar]
- Winkler, C., Courvoisier, T. J.-L., Di Cocco, G., et al. 2003, A&A, 411, L1 [NASA ADS] [CrossRef] [EDP Sciences] [Google Scholar]
- Woosley, S. E., Heger, A., Cumming, A., et al. 2004, ApJS, 151, 75 [NASA ADS] [CrossRef] [Google Scholar]
- Yan, Z., & Yu, W. 2015, ApJ, 805, 87 [NASA ADS] [CrossRef] [Google Scholar]
- Yu, W., & Yan, Z. 2009, ApJ, 701, 1940 [NASA ADS] [CrossRef] [Google Scholar]
All Tables
Best fit parameters determined for the hard and soft spectral state of SAX J1748.9–2021.
All Figures
|
Fig. 1. IBIS/ISGRI sky image centered on SAX J1748.9–2021 in the 20–100 keV range of the ∼100 ks ToO observation. The size of each pixel is 3′. |
| In the text | |
|
Fig. 2. SAX J1748.9–2021 light curve during the 2015 outburst. The vertical dashed lines, indicate the ∼100 ks INTEGRAL ToO time interval. The black, green, and red vertical lines indicate the times of the detected type-I X-ray bursts with INTEGRAL, Swift and XMM-Newton, respectively. In the bottom panel the inset shows the hard ISGRI light curve zoomed in at the spectral change time interval. The count rate drops to zero within 0.5 day. The hard and soft state data points used in the spectral analysis are color coded with light blue and pink, respectively (see Sect. 4). |
| In the text | |
|
Fig. 3. Unfolded broadband spectrum of SAX J1748.9–2021 showing the hard and soft spectral states. The data points are from the Swift/XRT (black crosses), INTEGRAL/JEM-X (red crosses), and INTEGRAL/ISGRI (green crosses). The best fit is obtained with the COMPPS model, represented by a solid blue line. The lower panels show the residuals between the data and the model. The Swift/XRT spectra have been rebinned for a better visualization. |
| In the text | |
|
Fig. 4. Recurrence time versus local mass accretion rate per unit area onto the compact object, where the circles and triangles represent the type-I X-ray bursts detected by XMM-Newton and INTEGRAL/JEM-X, respectively. The dashed red lines represent the best-fit power-law model for all bursts Δtrec ∼ ⟨ṁ⟩−1.02±0.03. The recurrence time decreased from ∼2 h to ∼1 h as the persistent spectrum showed the transition from the hard to the soft state. |
| In the text | |
Current usage metrics show cumulative count of Article Views (full-text article views including HTML views, PDF and ePub downloads, according to the available data) and Abstracts Views on Vision4Press platform.
Data correspond to usage on the plateform after 2015. The current usage metrics is available 48-96 hours after online publication and is updated daily on week days.
Initial download of the metrics may take a while.