Fig. 4.
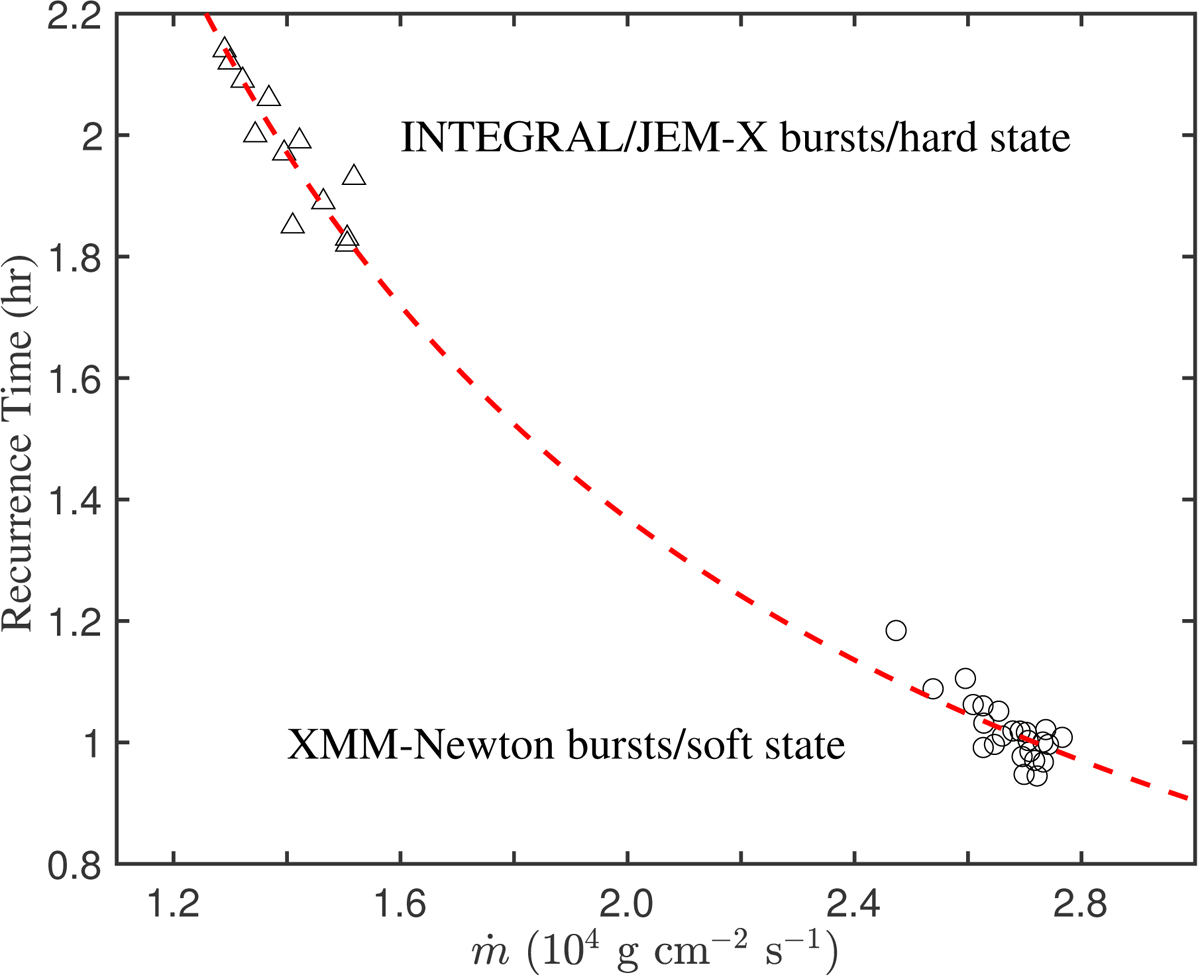
Recurrence time versus local mass accretion rate per unit area onto the compact object, where the circles and triangles represent the type-I X-ray bursts detected by XMM-Newton and INTEGRAL/JEM-X, respectively. The dashed red lines represent the best-fit power-law model for all bursts Δtrec ∼ ⟨ṁ⟩−1.02±0.03. The recurrence time decreased from ∼2 h to ∼1 h as the persistent spectrum showed the transition from the hard to the soft state.
Current usage metrics show cumulative count of Article Views (full-text article views including HTML views, PDF and ePub downloads, according to the available data) and Abstracts Views on Vision4Press platform.
Data correspond to usage on the plateform after 2015. The current usage metrics is available 48-96 hours after online publication and is updated daily on week days.
Initial download of the metrics may take a while.