Fig. 2.
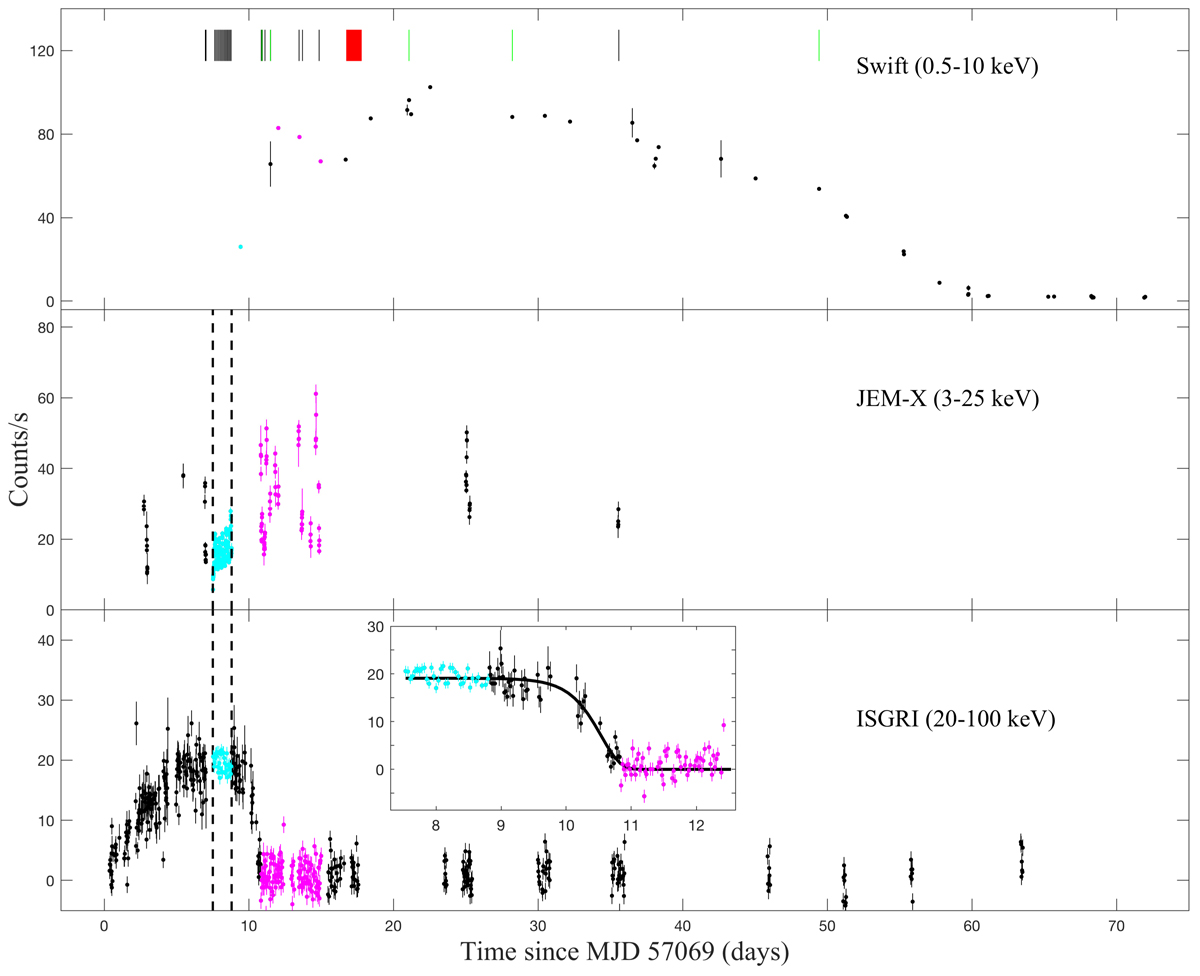
SAX J1748.9–2021 light curve during the 2015 outburst. The vertical dashed lines, indicate the ∼100 ks INTEGRAL ToO time interval. The black, green, and red vertical lines indicate the times of the detected type-I X-ray bursts with INTEGRAL, Swift and XMM-Newton, respectively. In the bottom panel the inset shows the hard ISGRI light curve zoomed in at the spectral change time interval. The count rate drops to zero within 0.5 day. The hard and soft state data points used in the spectral analysis are color coded with light blue and pink, respectively (see Sect. 4).
Current usage metrics show cumulative count of Article Views (full-text article views including HTML views, PDF and ePub downloads, according to the available data) and Abstracts Views on Vision4Press platform.
Data correspond to usage on the plateform after 2015. The current usage metrics is available 48-96 hours after online publication and is updated daily on week days.
Initial download of the metrics may take a while.