Fig. 9.
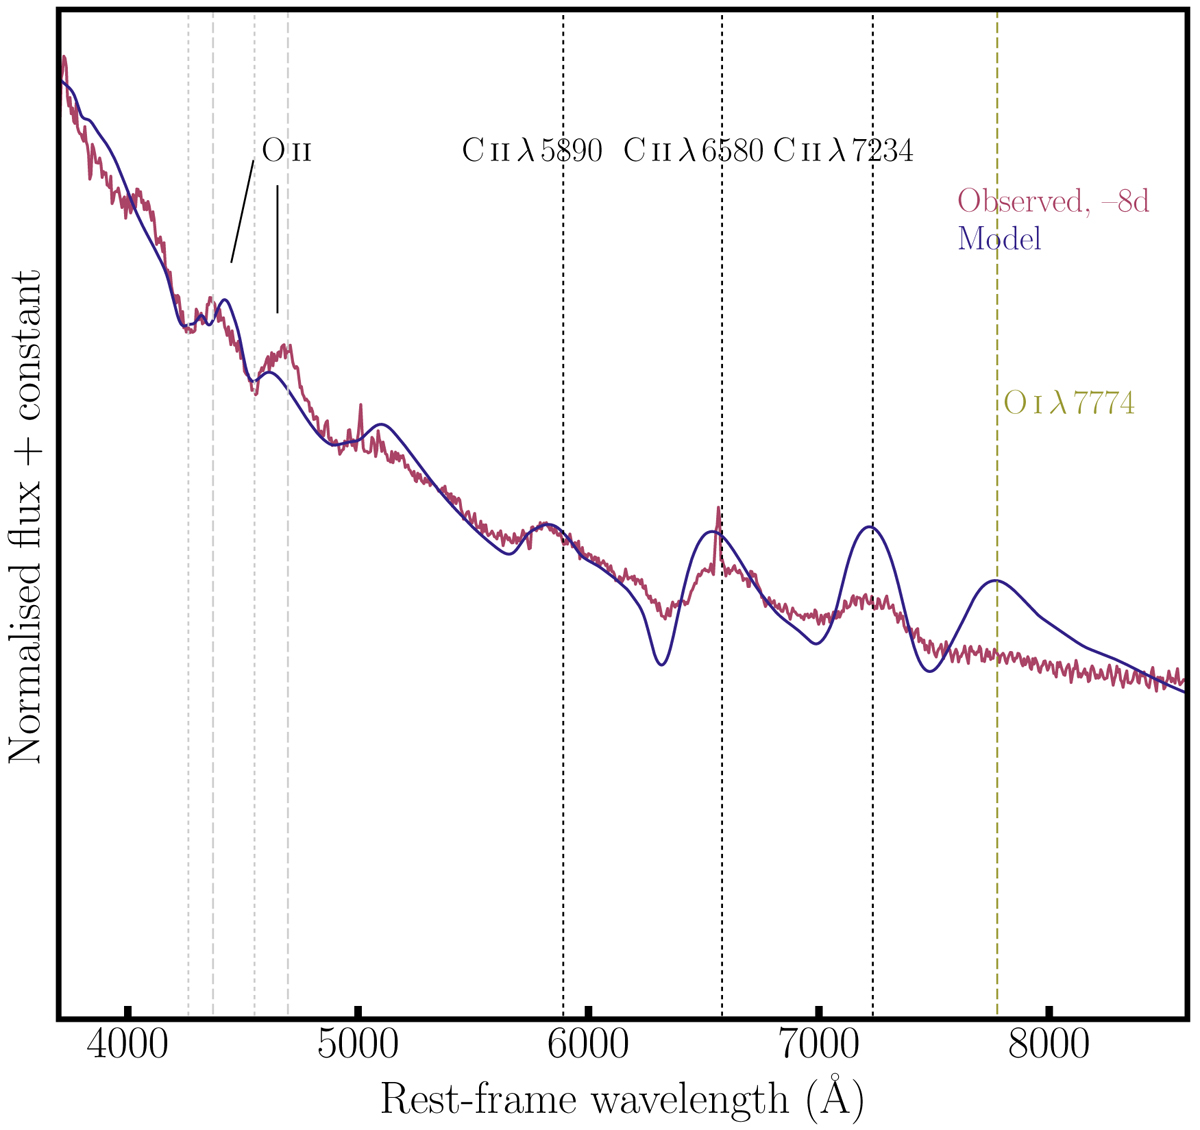
Comparison of an optical-wavelength spectrum of SN 2018bsz with a model spectrum from Dessart (in preparation). C II line rest-frame wavelengths are indicated by black dotted vertical lines. In the case of the O II lines we draw vertical grey dashed lines that align with the peaks in the spectra and vertical grey dotted lines for the troughs (absorption). O I λ7774 is clearly observed in the model, but not in the observations, and is indicated by the vertical yellow dashed line. (The model spectrum is at around 40 days post explosion and around 10 days post maximum and therefore does not correspond to the same exact epoch of the observed spectrum of SN 2018bsz.)
Current usage metrics show cumulative count of Article Views (full-text article views including HTML views, PDF and ePub downloads, according to the available data) and Abstracts Views on Vision4Press platform.
Data correspond to usage on the plateform after 2015. The current usage metrics is available 48-96 hours after online publication and is updated daily on week days.
Initial download of the metrics may take a while.