Fig. 6.
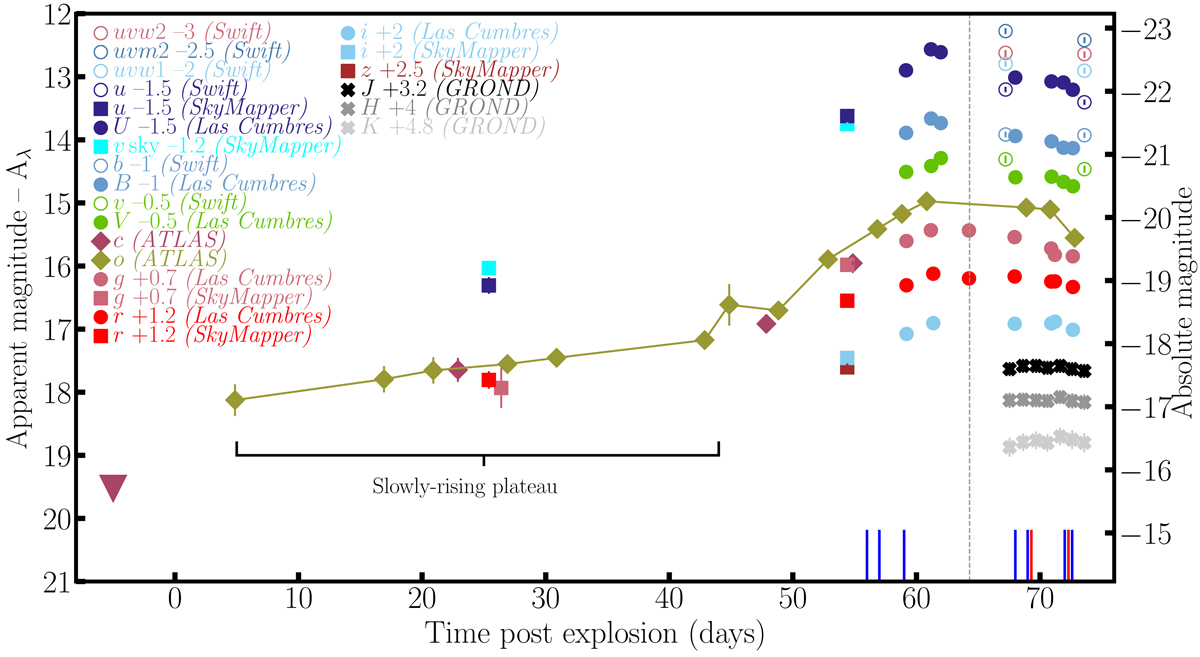
UV, optical and near-IR light curves of SN 2018bsz. All photometry is corrected for both Milky Way and host galaxy line of sight extinction. Epochs of optical spectroscopy are shown as blue lines on the x-axis, while epochs of near-IR spectroscopy are indicated by red lines. The upper limit of the most recent non-detection prior to discovery is shown as a maroon upside-down triangle.
Current usage metrics show cumulative count of Article Views (full-text article views including HTML views, PDF and ePub downloads, according to the available data) and Abstracts Views on Vision4Press platform.
Data correspond to usage on the plateform after 2015. The current usage metrics is available 48-96 hours after online publication and is updated daily on week days.
Initial download of the metrics may take a while.