Fig. 4.
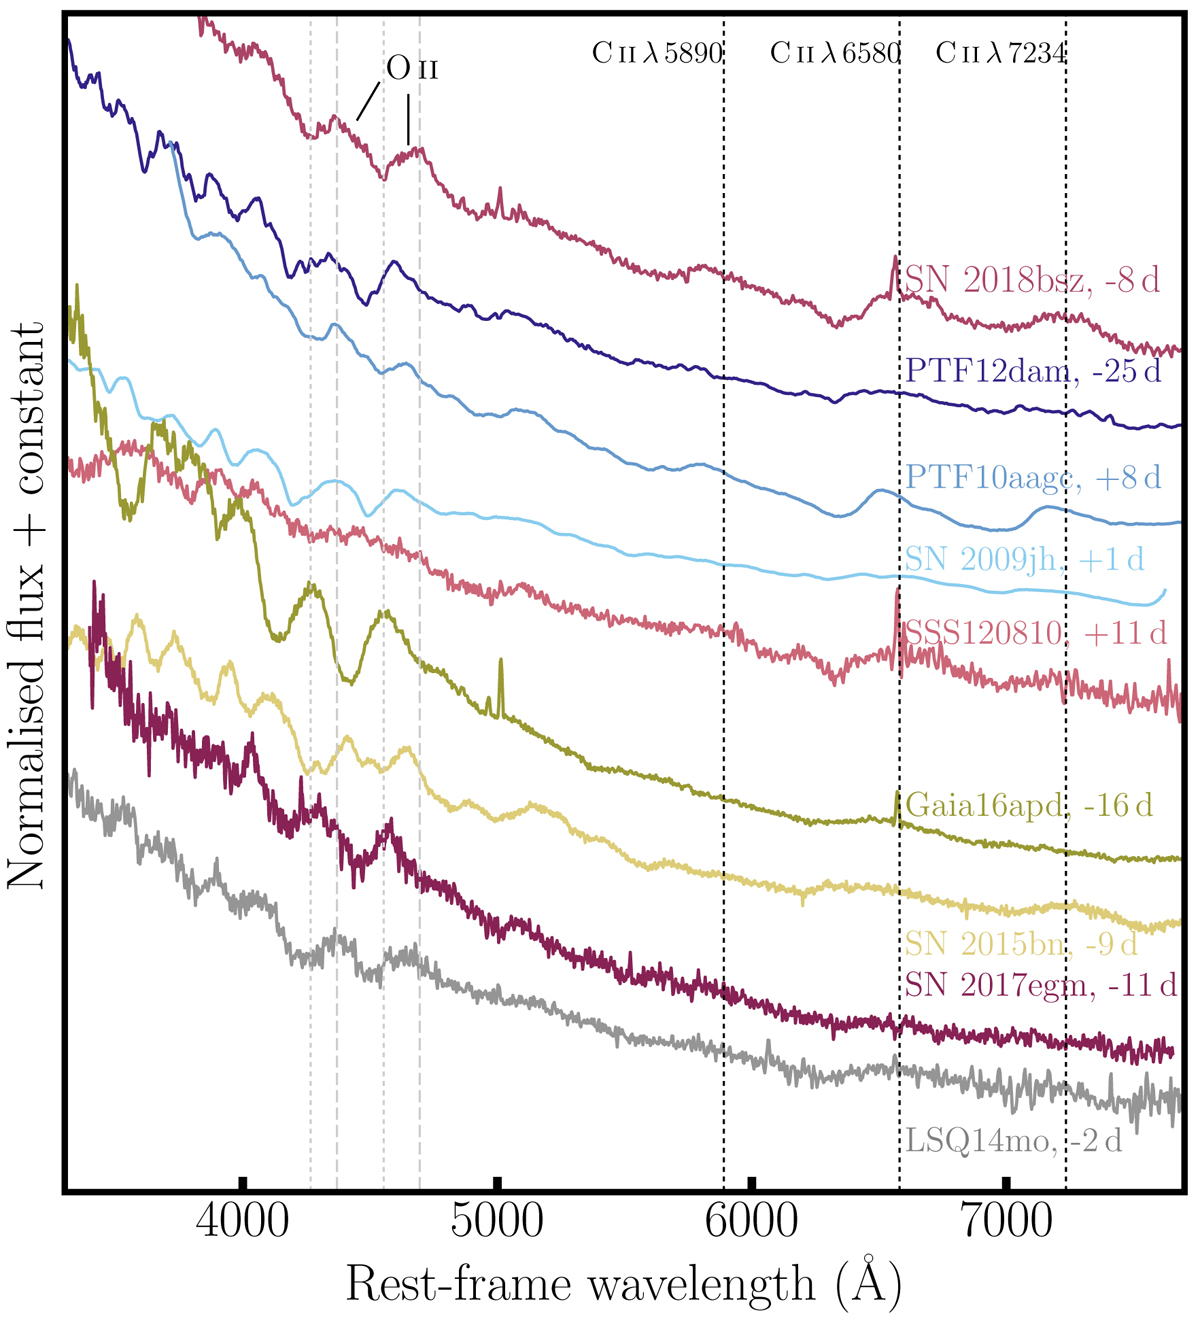
Spectral comparison between SN 2018bsz at –9 day (from maximum light) and SLSNe of the best SNID matches together with three well observed, nearby literature events, and a well-observed fast-evolving SLSN-I. The rest wavelength of the three most prominent C II lines are shown by dotted black lines, while the peaks and troughs of the w-shaped O II feature for SN 2018bsz are indicated by dashed and dotted grey lines respectively. The latter enables a direct comparison to the peaks and troughs found in other SLSNe-I. References: PTF12dam (Quimby et al. 2018); PTF10aagc (Quimby et al. 2018); SN 2009jh (Quimby et al. 2018), these first three are smoothed spectra; SSS120810 (full name SSS120810-231802-560926, Nicholl et al. 2014), Gaia16apd (Kangas et al. 2017); SN 2015bn (Nicholl et al. 2016); SN 2017egm (Bose et al. 2018); LSQ14mo (Chen et al. 2017a).
Current usage metrics show cumulative count of Article Views (full-text article views including HTML views, PDF and ePub downloads, according to the available data) and Abstracts Views on Vision4Press platform.
Data correspond to usage on the plateform after 2015. The current usage metrics is available 48-96 hours after online publication and is updated daily on week days.
Initial download of the metrics may take a while.