Fig. 2.
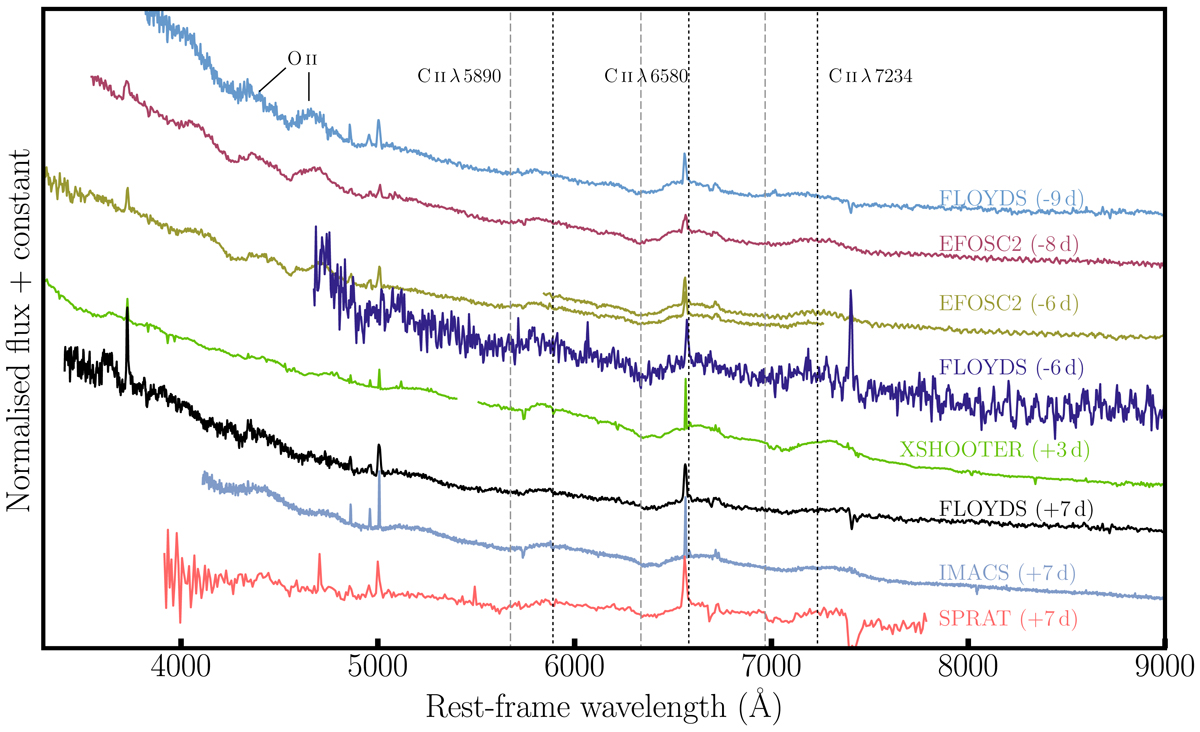
Optical wavelength spectral sequence of SN 2018bsz: from nine days before to seven days after maximum light (MJD = 58267.5 in r). Dotted vertical black lines indicate the rest wavelength of three C II lines, while the dashed vertical grey lines indicate the same C II lines at a velocity of –11 000 km s−1. Two additional lines are clearly observed between 4000 and 5000 Å that are most likely associated with O II. Narrow emission is visible due to an underlying host H II region (see e.g. Hα, Hβ) and is not associated with the transient itself. Additional line identifications are presented in Fig. 5. Spectra have been corrected for line of sight extinction, both in our own Milky Way and from within the host galaxy of SN 2018bsz. We do not plot two spectra obtained with SPRAT at +3 days and with FLOYDS at +3 days, due to their low S/N (but their details are listed in Table A.1 and the spectra will be released). The X-Shooter spectra have been binned to 6 Å in wavelength.
Current usage metrics show cumulative count of Article Views (full-text article views including HTML views, PDF and ePub downloads, according to the available data) and Abstracts Views on Vision4Press platform.
Data correspond to usage on the plateform after 2015. The current usage metrics is available 48-96 hours after online publication and is updated daily on week days.
Initial download of the metrics may take a while.