Fig. 11.
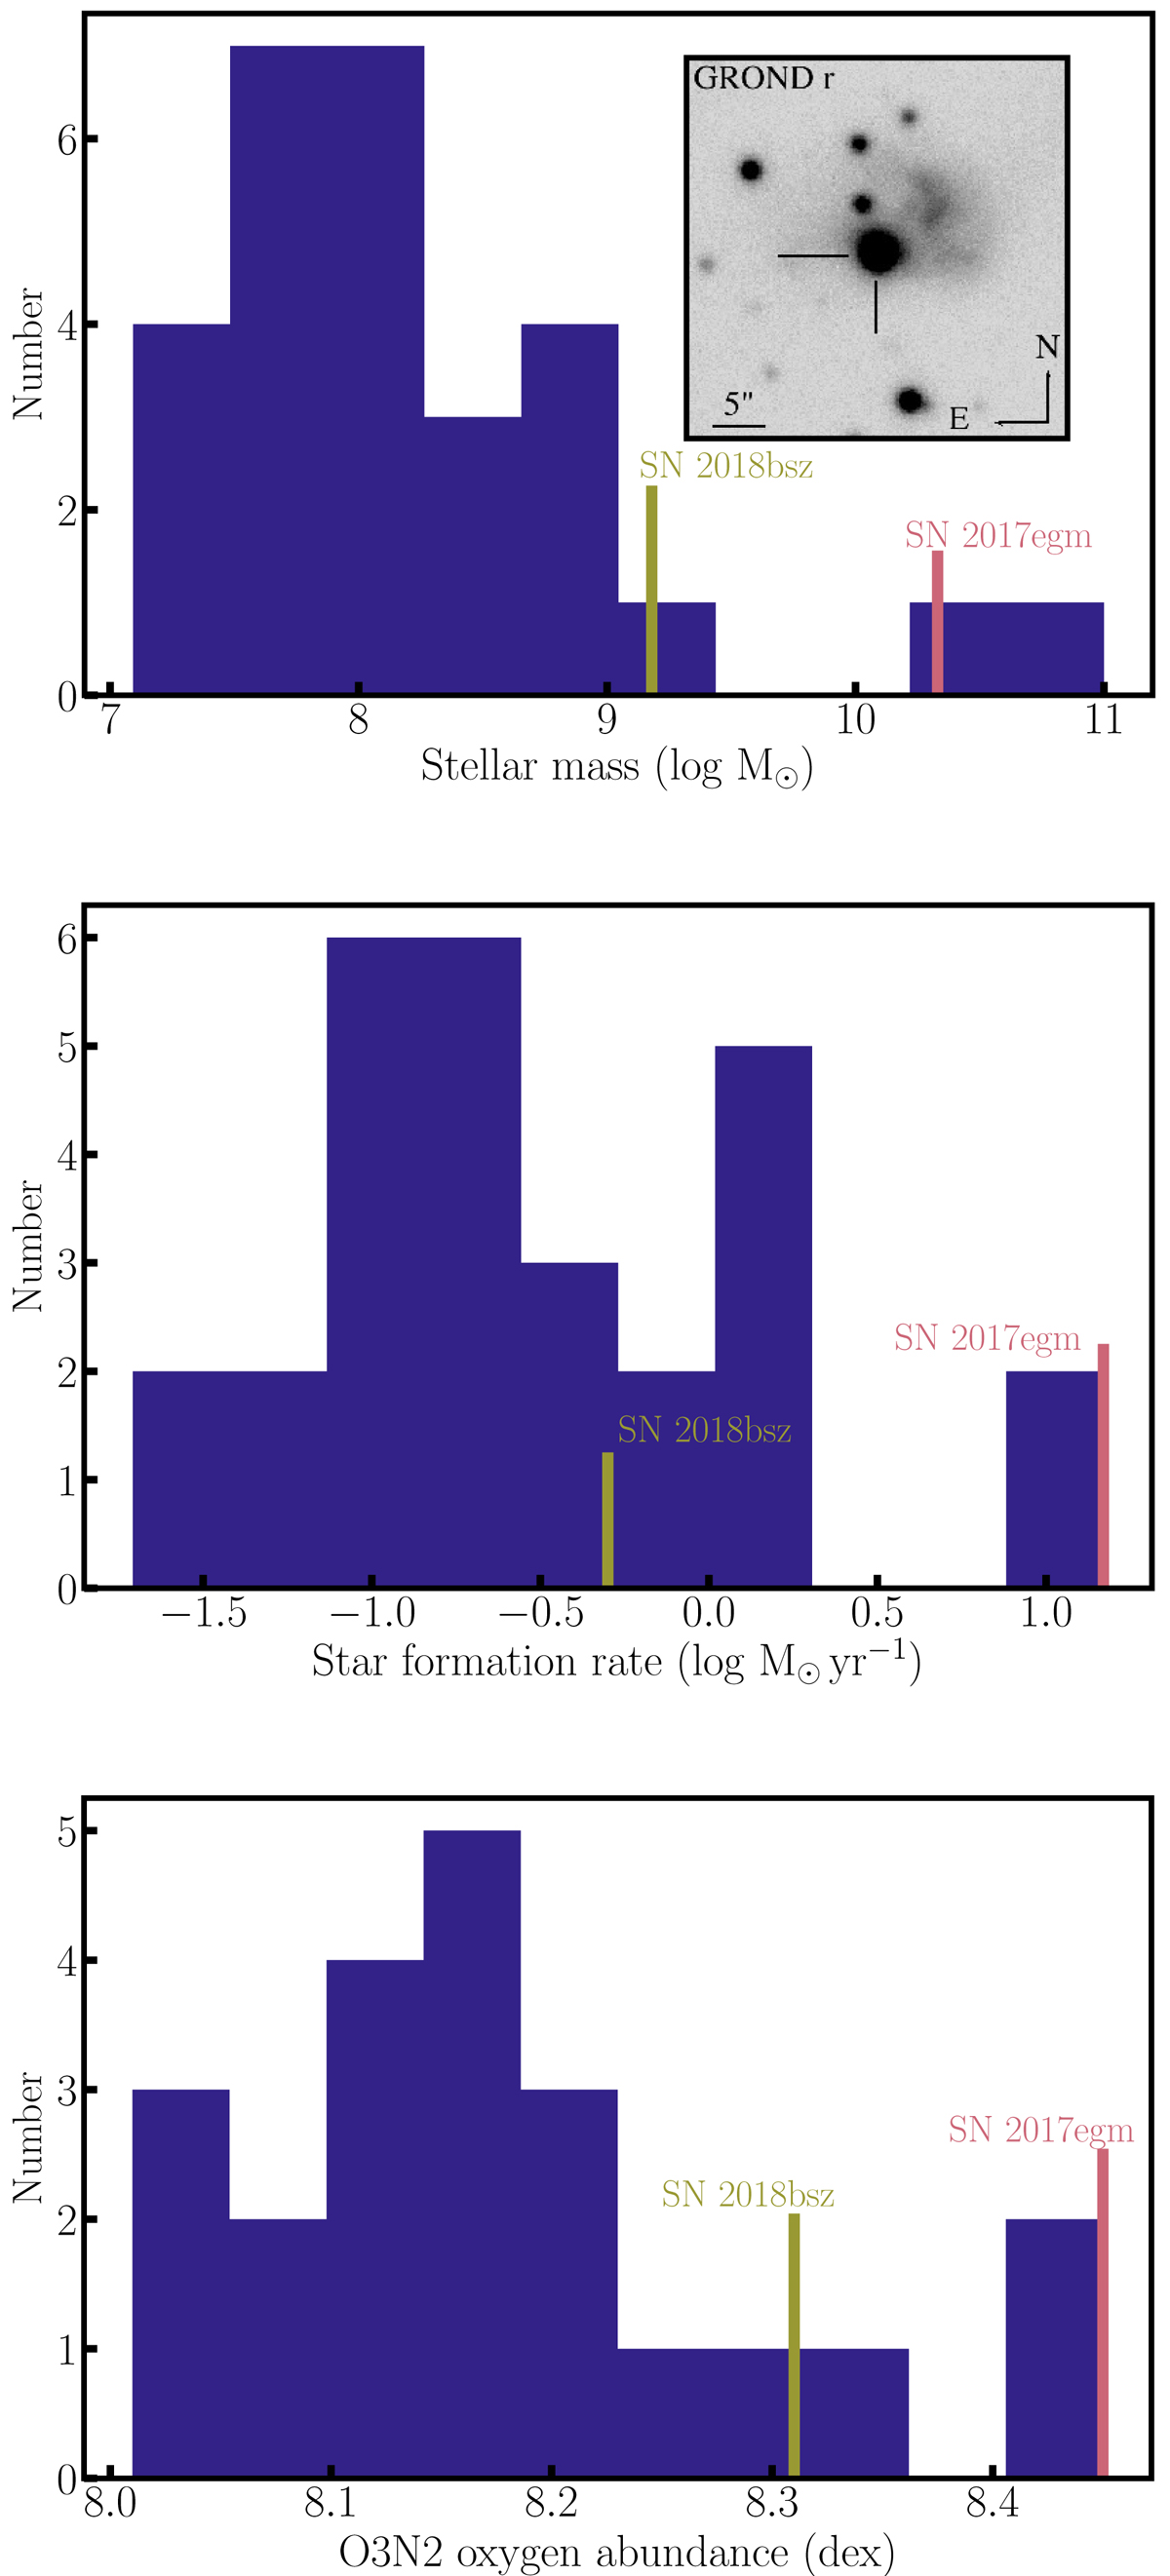
Histograms of the environment and host properties of SN 2018bsz as compared to literature samples and SN 2017egm; the previously lowest-redshift SLSN. Top: integrated host galaxy stellar mass. The inset shows a GROND r-band image of SN 2018bsz (indicated by the two perpendicular black lines) and its host galaxy. Middle: integrated host SFR. Bottom: host environment oxygen abundance on the O3N2 scale (a combination of global galaxy and nearby host H II region measurements). On each plot the value of SN 2018bsz is indicated, together with that of SN 2017egm.
Current usage metrics show cumulative count of Article Views (full-text article views including HTML views, PDF and ePub downloads, according to the available data) and Abstracts Views on Vision4Press platform.
Data correspond to usage on the plateform after 2015. The current usage metrics is available 48-96 hours after online publication and is updated daily on week days.
Initial download of the metrics may take a while.