Fig. 5
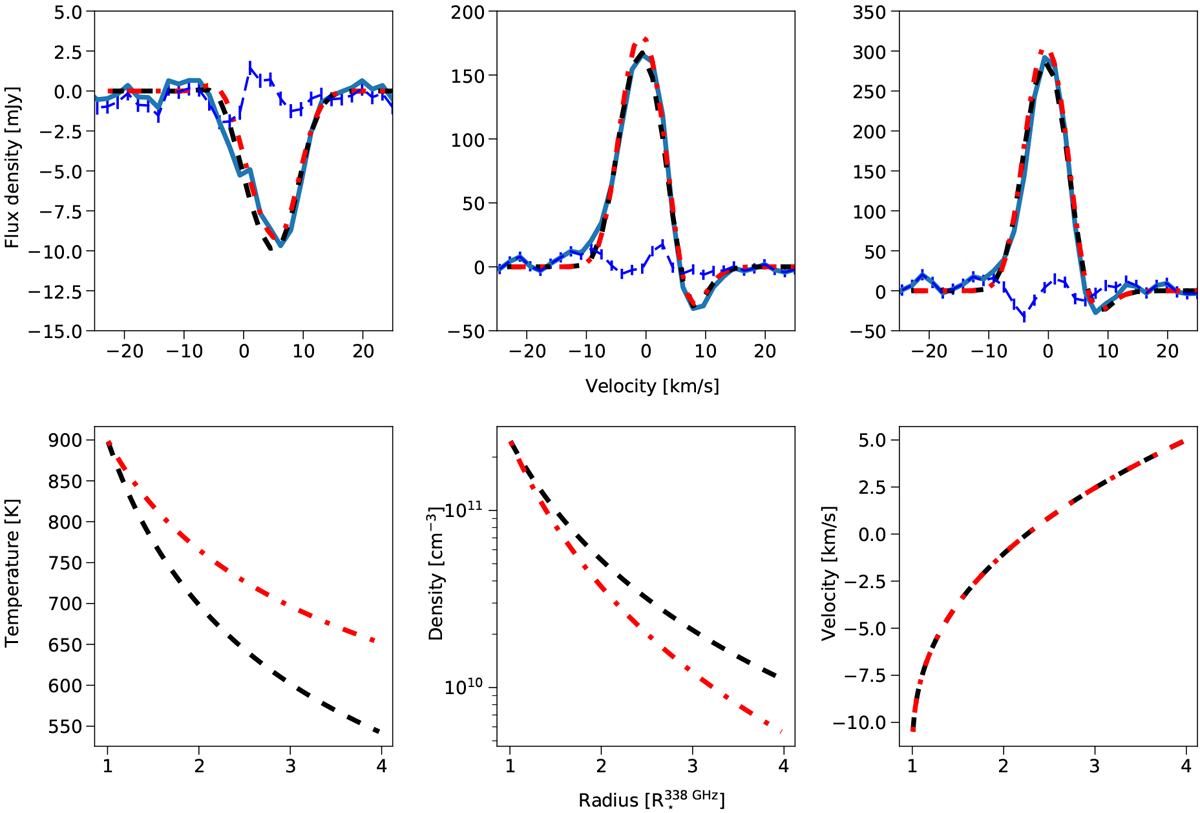
Best model fit to the CO v = 1, J = 3−2 line observed using ALMA (dashed black line) and preferred model after constraints from the 13CO J = 3−2 line are considered (dot-dashed red line). The parameters of these two models are given in Table 3. Upper panels: observed spectra of the CO v = 1, J = 3−2 line (solidblue line) and residuals (thin blue line with error bars) obtained by subtracting the best-fit model from the observed spectra. The spectra were extracted from circular regions with radii of 20 mas (left panel), 50 mas (middle panel), and 100 mas (right panel). Lower panels: gas temperature (left panel), density (middle panel), and velocity profiles (right panel) of the two models. The velocity is positive for material flowing away from the stellar surface.
Current usage metrics show cumulative count of Article Views (full-text article views including HTML views, PDF and ePub downloads, according to the available data) and Abstracts Views on Vision4Press platform.
Data correspond to usage on the plateform after 2015. The current usage metrics is available 48-96 hours after online publication and is updated daily on week days.
Initial download of the metrics may take a while.