Fig. 3
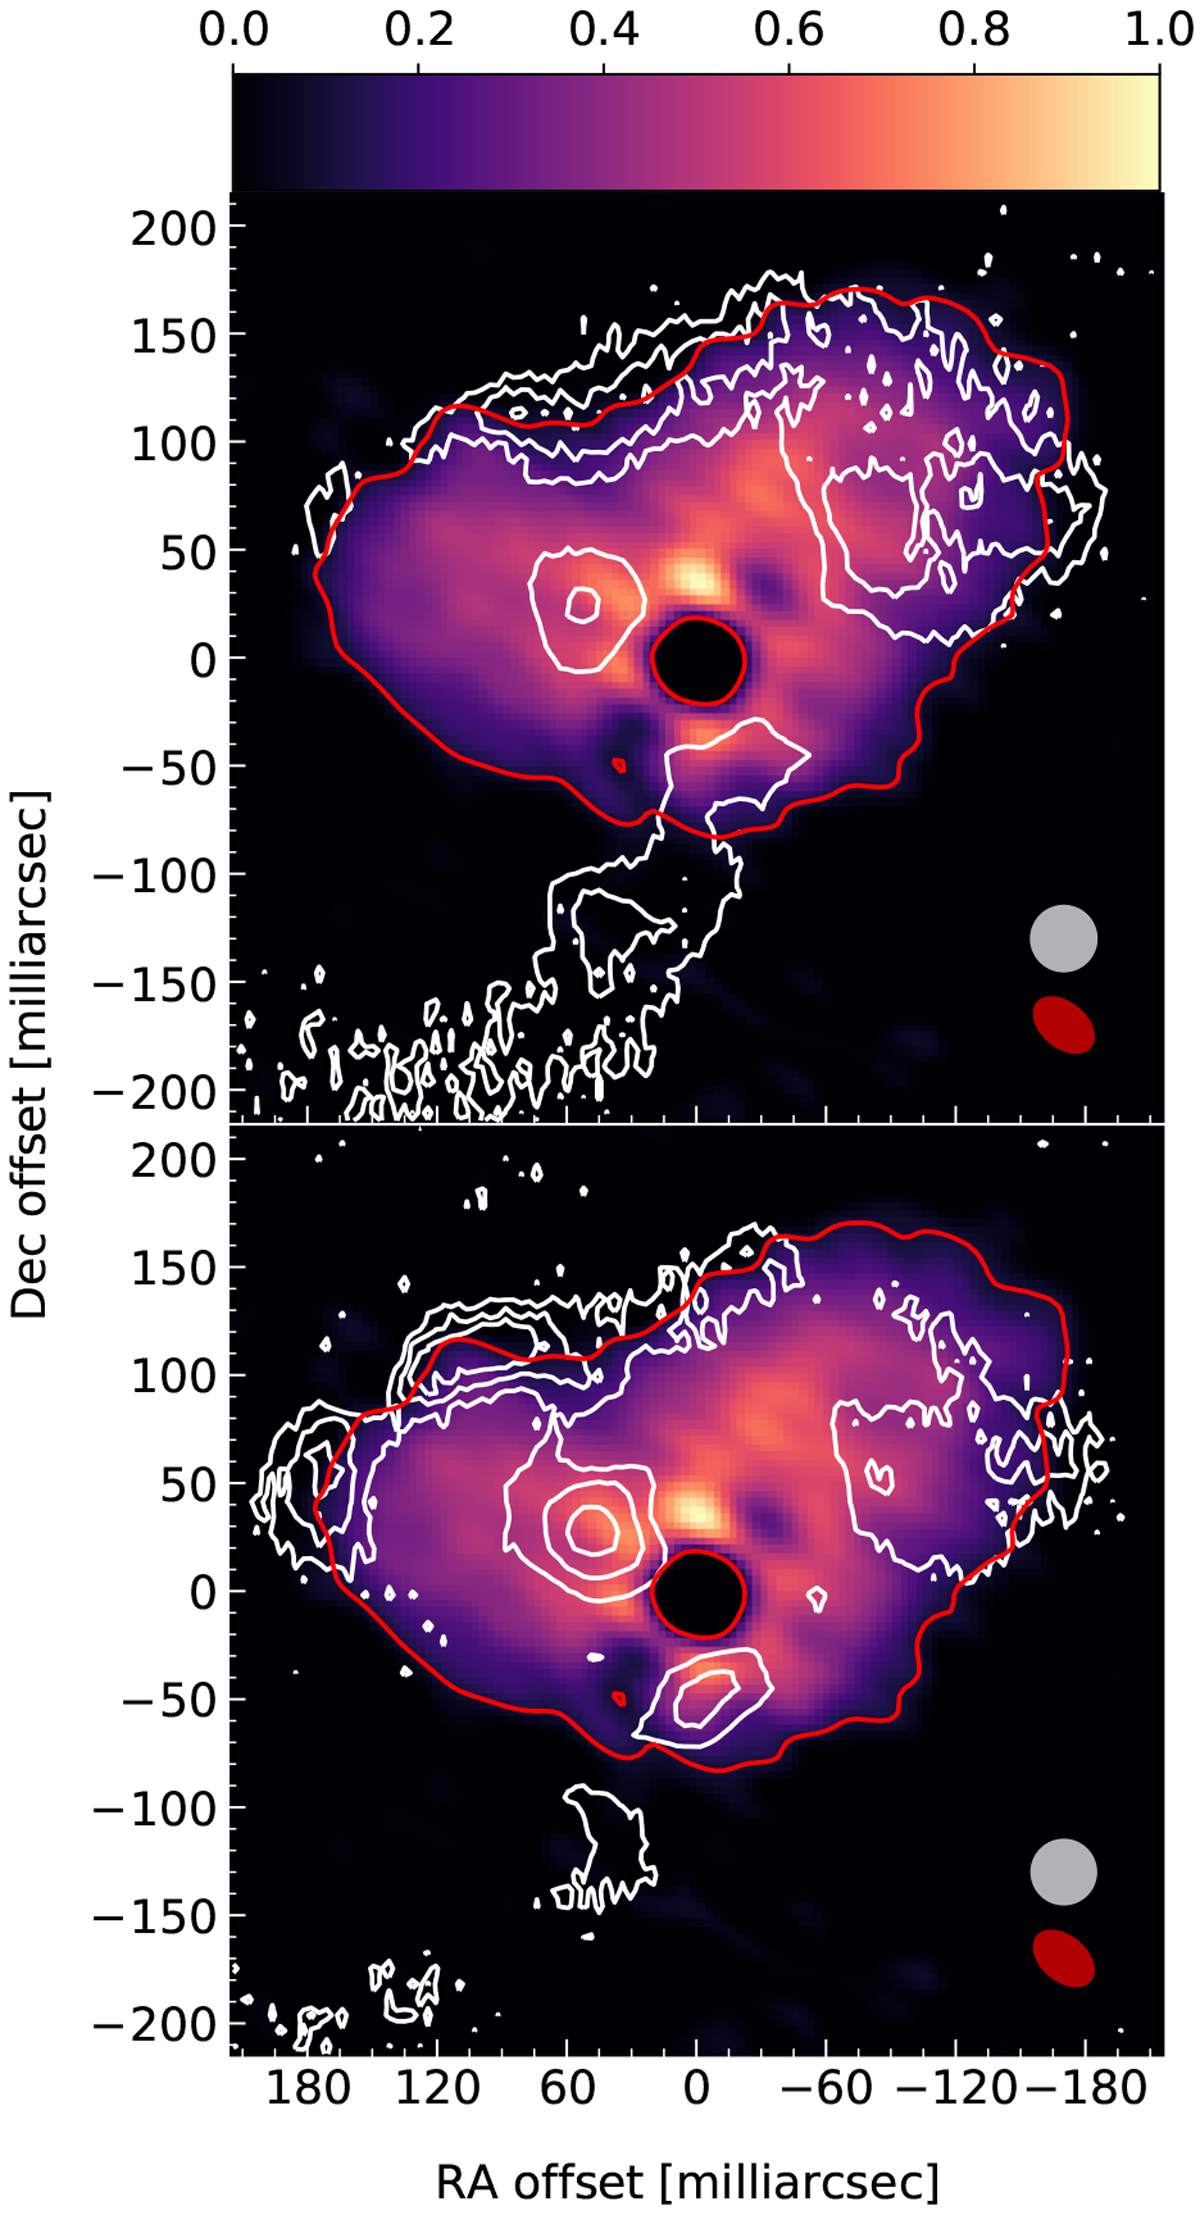
Comparison between a low-excitation SO NJ = 88−77 line observed using ALMA and the polarized light observed using ZIMPOL. The SO NJ = 88−77 integrated line intensity was normalized to the peak value in the image and is shown by the colour scale. The red contour shows the 10% level of the SO emission, and represents the edge of the emission region. The white contours show the 1.5, 2.3, and 3.1% levels of the polarization degree observed using ZIMPOL and filters NR, λC = 0.65 μm (top panel), and cnt820, λC = 0.82 μm (bottom panel). The white and red ellipses on the lower right corner show, respectively, the FWHM of the observed PSF reference star at the given filter in the visible and the beam of the ALMA observations. The offsets in declination and right ascension are given with respect to the position of Mira A.
Current usage metrics show cumulative count of Article Views (full-text article views including HTML views, PDF and ePub downloads, according to the available data) and Abstracts Views on Vision4Press platform.
Data correspond to usage on the plateform after 2015. The current usage metrics is available 48-96 hours after online publication and is updated daily on week days.
Initial download of the metrics may take a while.