Fig. 2
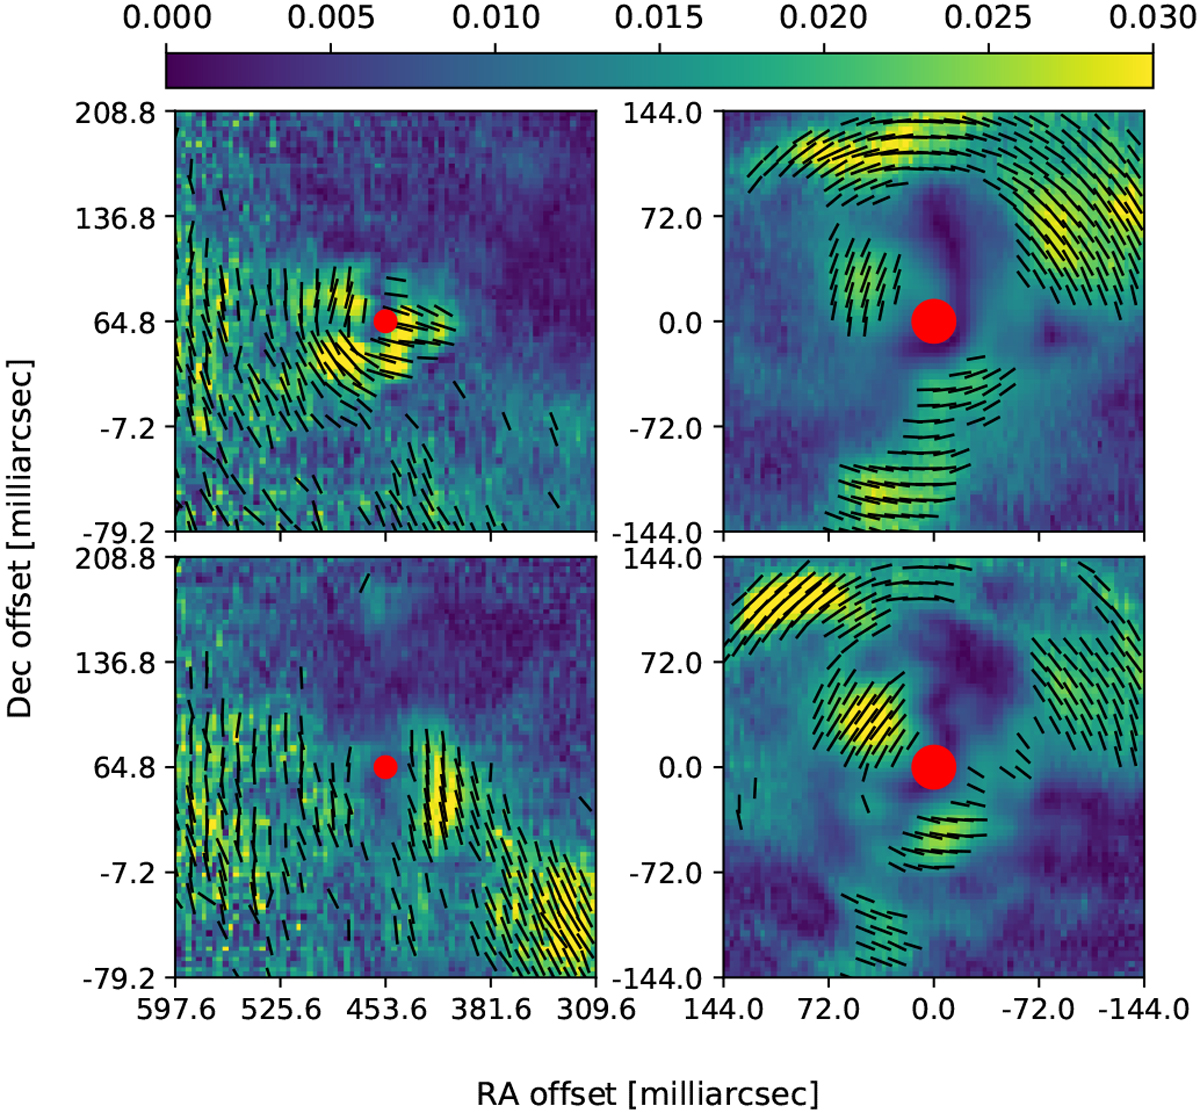
Polarization degree (shown by the colour map) and direction of the polarization vectors around Mira A (right panels) and Mira B (left panels). Upper and lower panels: image in the NR and the cnt820 filters, respectively. The red dots mark the positions of the two stars. The vectors are drawn when the polarization degree is higher than 1.5%. The offsets in declination and right ascension are given with respect to the position of Mira A.
Current usage metrics show cumulative count of Article Views (full-text article views including HTML views, PDF and ePub downloads, according to the available data) and Abstracts Views on Vision4Press platform.
Data correspond to usage on the plateform after 2015. The current usage metrics is available 48-96 hours after online publication and is updated daily on week days.
Initial download of the metrics may take a while.