Fig. 1.
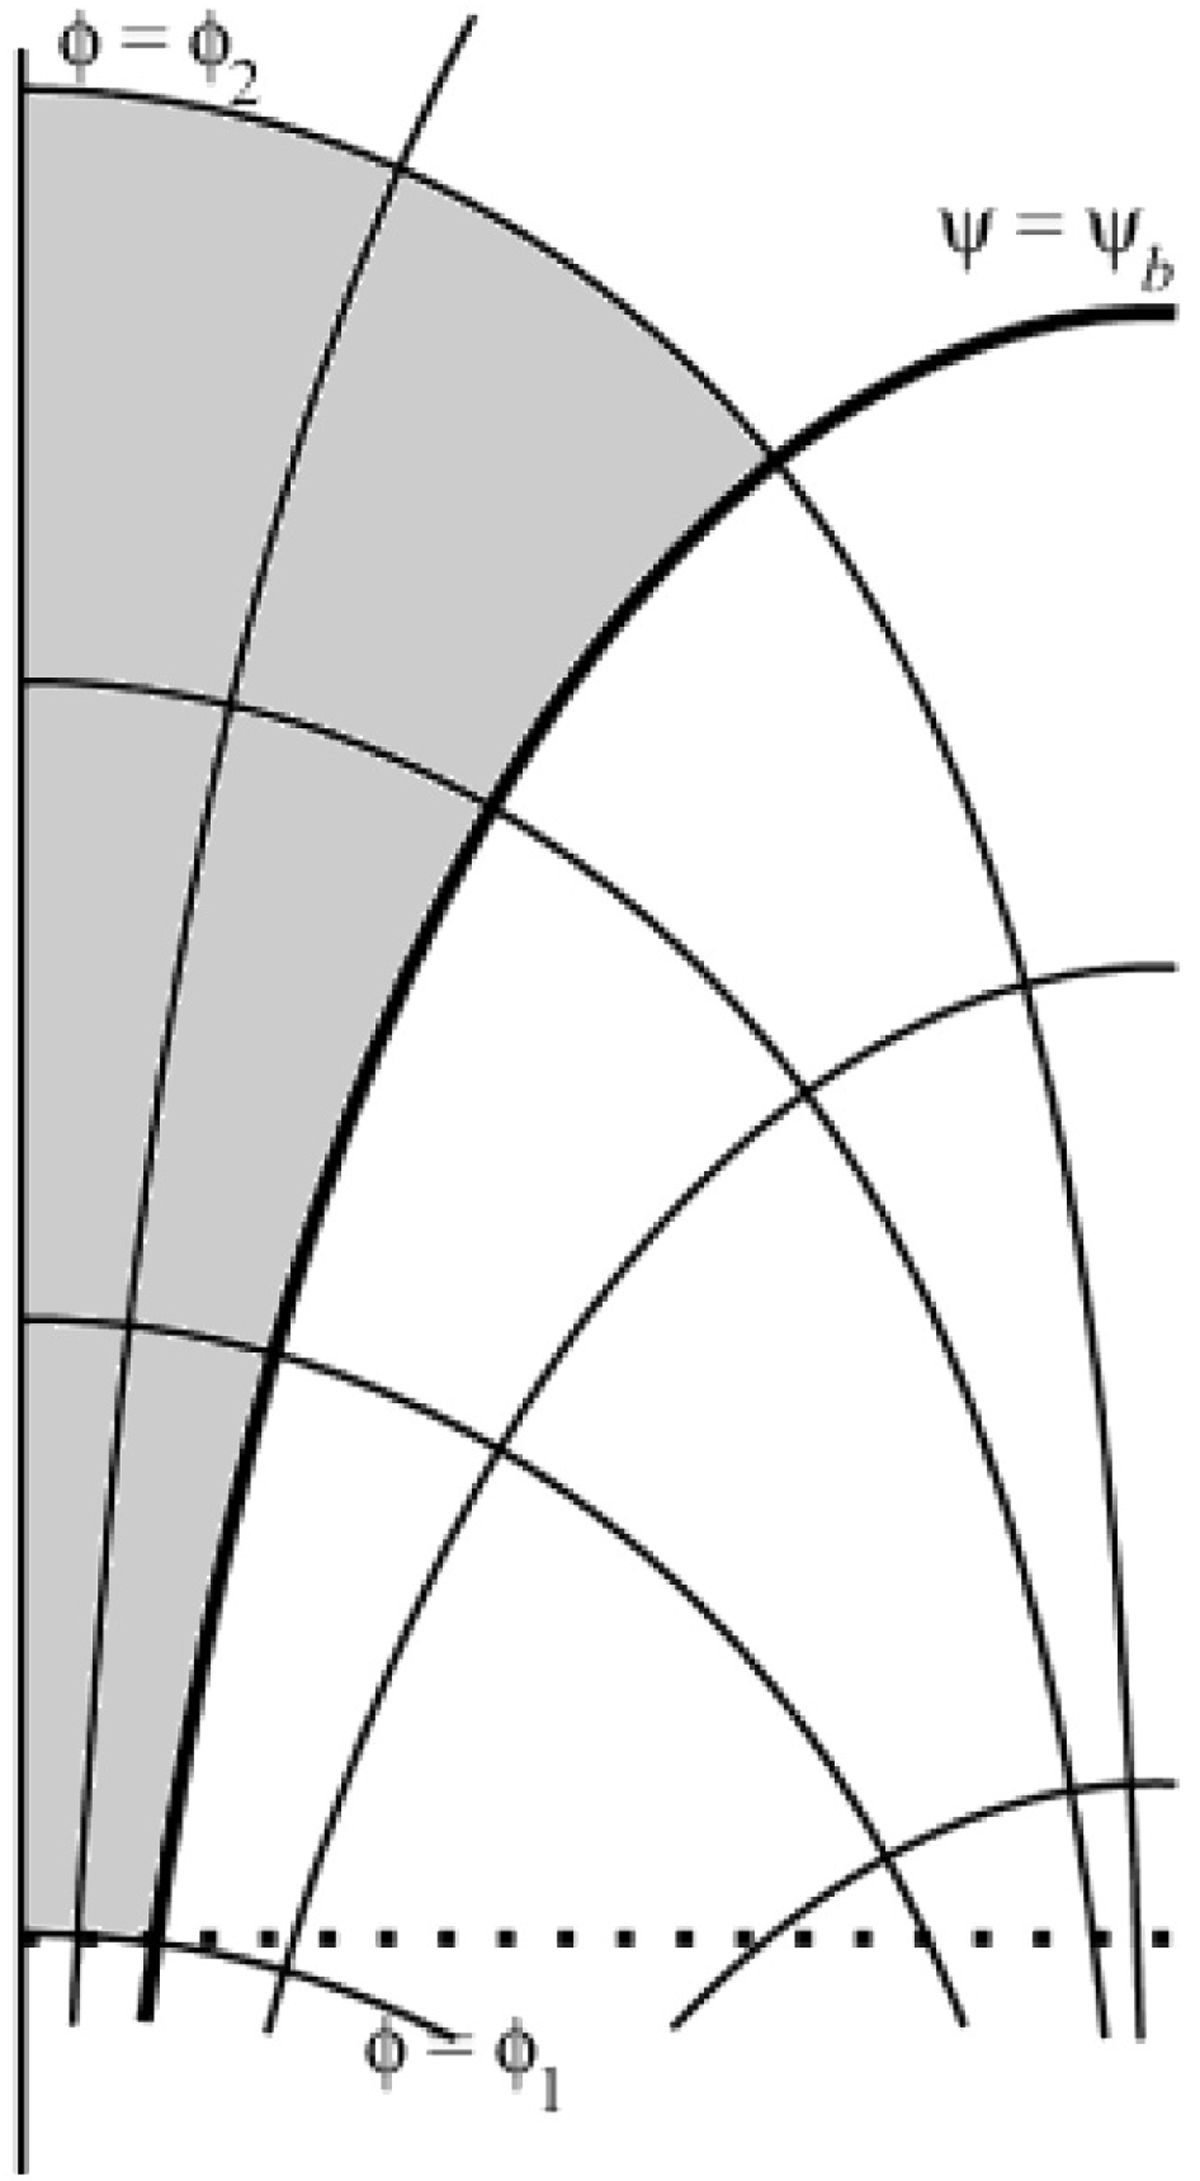
Sketch of domain ![]() . The coordinate lines are shown in the plane θ = constant. The vertical curves are the magnetic field lines defined by the equation ψ = constant. The horizontal curves are defined by the equation ϕ = constant. The thick vertical curve is the boundary of the region where the wave propagation is considered. It is defined by the equation ψ = ψb; ϕ1 = −H and ϕ2 = −He−6. It is assumed that the waves are driven at the line ϕ = ϕ1. The dotted line shows the level z = 0.
. The coordinate lines are shown in the plane θ = constant. The vertical curves are the magnetic field lines defined by the equation ψ = constant. The horizontal curves are defined by the equation ϕ = constant. The thick vertical curve is the boundary of the region where the wave propagation is considered. It is defined by the equation ψ = ψb; ϕ1 = −H and ϕ2 = −He−6. It is assumed that the waves are driven at the line ϕ = ϕ1. The dotted line shows the level z = 0.
Current usage metrics show cumulative count of Article Views (full-text article views including HTML views, PDF and ePub downloads, according to the available data) and Abstracts Views on Vision4Press platform.
Data correspond to usage on the plateform after 2015. The current usage metrics is available 48-96 hours after online publication and is updated daily on week days.
Initial download of the metrics may take a while.