Fig. 4
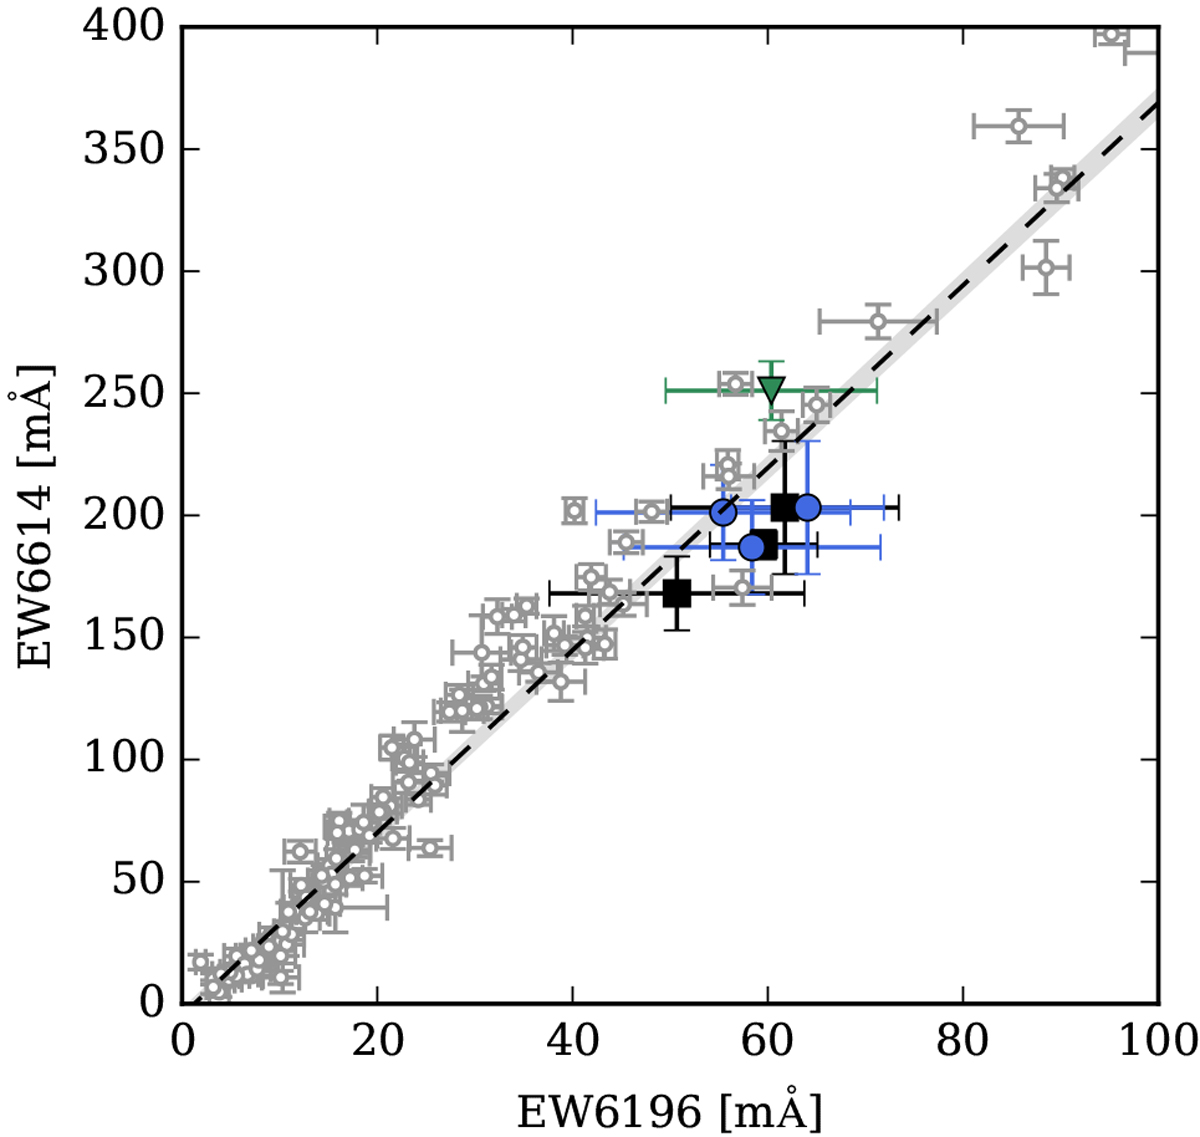
Correlation between the DIBs at 6614 and 6196 Å. The dashed line represents the relation found by McCall et al. (2010; grey dots) and the grey area shows the 1σ errors to the fit. The blue circles represent the sightlines towards objects with circumstellar disks, the green triangles towards stars with IR excess longwards of 2.5 μm, and the black squares towards OB stars.
Current usage metrics show cumulative count of Article Views (full-text article views including HTML views, PDF and ePub downloads, according to the available data) and Abstracts Views on Vision4Press platform.
Data correspond to usage on the plateform after 2015. The current usage metrics is available 48-96 hours after online publication and is updated daily on week days.
Initial download of the metrics may take a while.