Fig. A.6
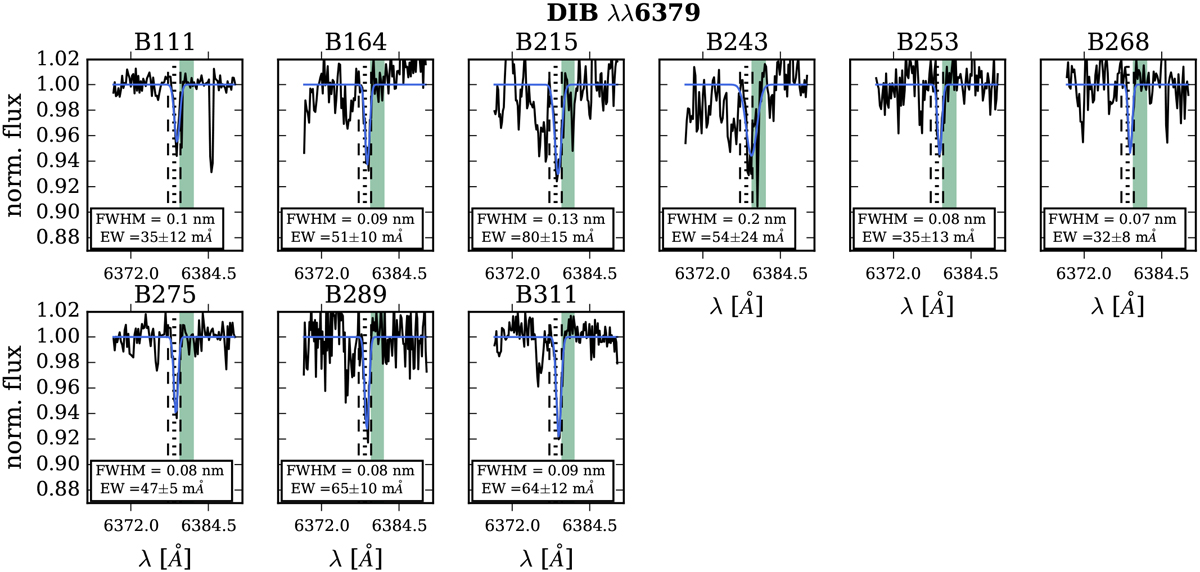
DIB profiles at 6379 Å. The vertical dashed lines show the integration limits used to calculate the DIB strength, the dotted line shows the central wavelength of the DIB, and the green shaded area shows the region in which the error was calculated. We show the Gaussian fit to the DIB profile with a solid blue line. The white box at the bottom of each panel indicates the FWHM and EW of this DIB for each object.
Current usage metrics show cumulative count of Article Views (full-text article views including HTML views, PDF and ePub downloads, according to the available data) and Abstracts Views on Vision4Press platform.
Data correspond to usage on the plateform after 2015. The current usage metrics is available 48-96 hours after online publication and is updated daily on week days.
Initial download of the metrics may take a while.