Fig. 11
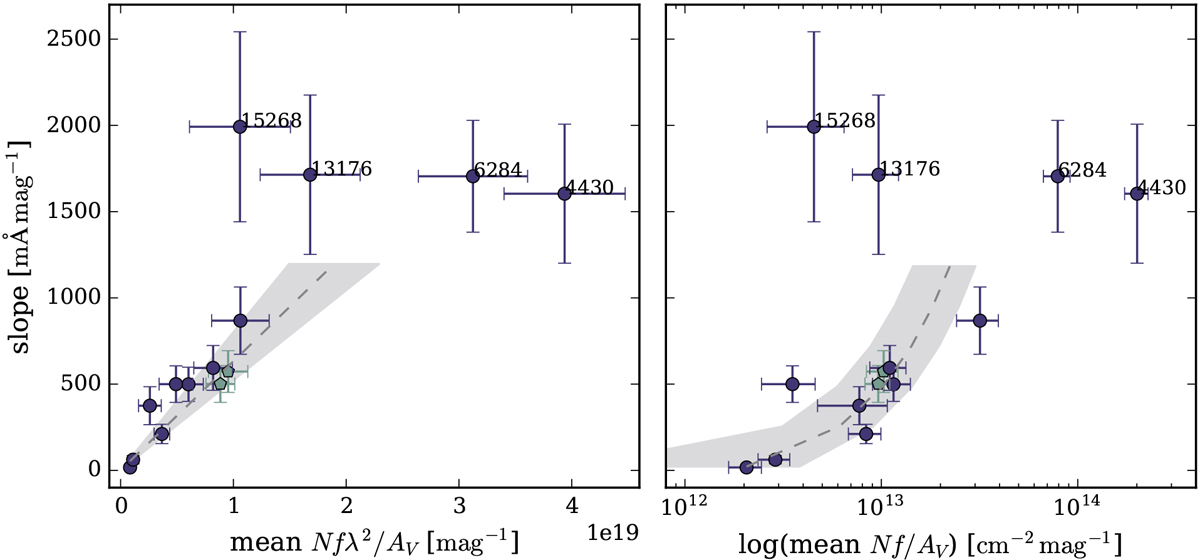
Slope representing the sensitivity of EW/AV with changesin ![]() vs. mean AV normalised line strength (left panel, expressed as Nf∕AV) and vs. the log of this quantity (right panel) for all sightlines. The dashed line and the shaded regions represent the linear fit to the group of DIBs with slopes ≲ 1000 and the 2σ error bars to the fit. The two
vs. mean AV normalised line strength (left panel, expressed as Nf∕AV) and vs. the log of this quantity (right panel) for all sightlines. The dashed line and the shaded regions represent the linear fit to the group of DIBs with slopes ≲ 1000 and the 2σ error bars to the fit. The two ![]() DIBs are represented with light green pentagons.
DIBs are represented with light green pentagons.
Current usage metrics show cumulative count of Article Views (full-text article views including HTML views, PDF and ePub downloads, according to the available data) and Abstracts Views on Vision4Press platform.
Data correspond to usage on the plateform after 2015. The current usage metrics is available 48-96 hours after online publication and is updated daily on week days.
Initial download of the metrics may take a while.